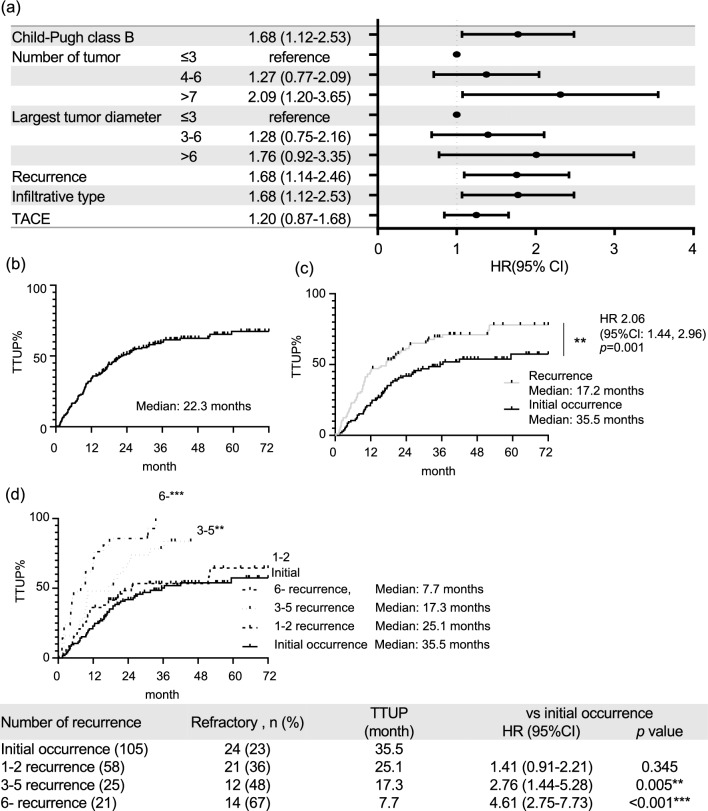
Figure 2.
(a) Forest plot with hazard ratios based on multivariate Cox regression analysis about TTUP. Kaplan–Meier curves of the TTUP in (b) all patients, (c) patients who underwent locoregional and surgical therapies because of initial occurrence or consecutive recurrence, and (d) patients who underwent locoregional and surgical therapies for each number of recurrences after curative therapy. Asterisks indicate statistically significant differences of means (0.01 ≤ * P < 0.05; 0.001 ≤ ** P < 0.01; *** P < 0.001). TTUP: time to untreatable progression by TACE, vs: versus.

