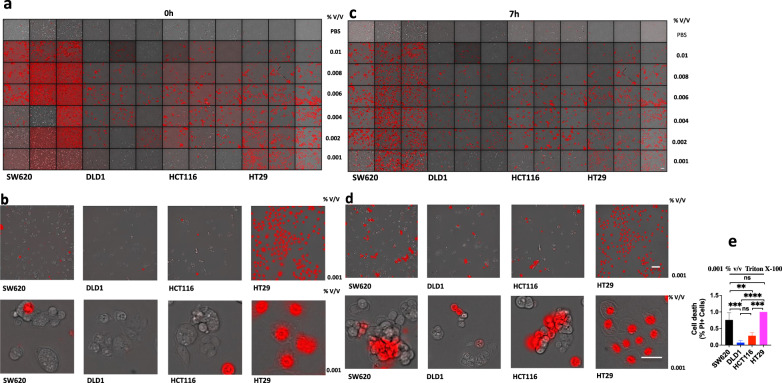
Fig. 10. Triton X-100 induces lysis of cell membranes.
SW620, DLD1, HCT116, or HT29 were treated by Triton X-100 at 0.01, 0.008, 0.006, 0.004, 0.002, 0.001% v/v for 0 h, 7 h (a–d). All cells were stained by PI, and time-lapse confocal images of PI + DIC. One-way ANOVA was used to determine significance (*P < 0.05; **P < 0.01; ***P < 0.001; ****P < 0.0001; NS, not significant) (e). Scale bars, 50 µm. Data are representative of at least three independent experiments.

