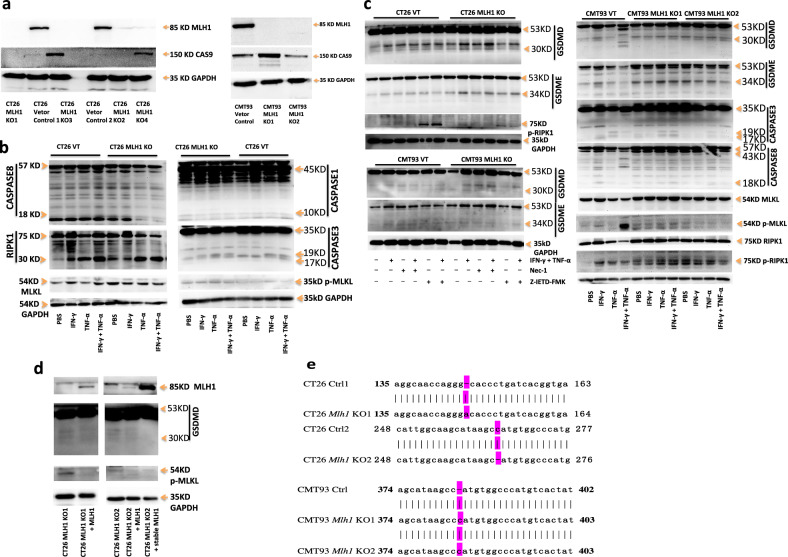
Fig. 11. Mlh1 knockout CT26 and CMT93 undergo natural hyperactivation of GSDMD, GSDME, and p-MLKL.
Immunoblot analysis of MLH1, CAS9 in CT26 and CMT93 Vector Control, CT26 and CMT93 MLH1 KO (a); pro-(P53) and activated (P30) GSDMD, pro-(P53) and activated (P34) GSDME, pro-(P45) and activated (P10) CASP1, pro-(P35) and cleaved (P19 and P17) CASP3, pro-(P55) and cleaved (P18) CASP8, total MLKL (tMLKL), p-MLKL, p-RIPK1, and pro- (P75) and cleaved (P30) RIPK1 in CT26 and CMT93 Vector Control, CT26 and CMT93 MLH1 KO, after treatment with IFN-γ alone, TNF-α alone or IFN-γ + TNF-α for 96 h or treatment with Nec-1 alone, Z-IETD-FMK alone, IFN-γ + TNF-α, IFN-γ + TNF-α + Nec-1 or IFN-γ + TNF-α + Z-IETD-FMK for 24 h (b, c); MLH1, pro-(P53) and activated (P30) GSDMD, p-MLKL in CT26 MLH1 KO1 + Mlh1, CT26 MLH1 KO2 + Mlh1 and CT26 MLH1 KO2 + stable Mlh1 (d). e genome sequencing was used to identify alterations of the Mlh1 sequence in the indicated cell clones. The effects of these changes were frameshifts. GAPDH was used as the internal control. Data are representative of at least three independent experiments.

