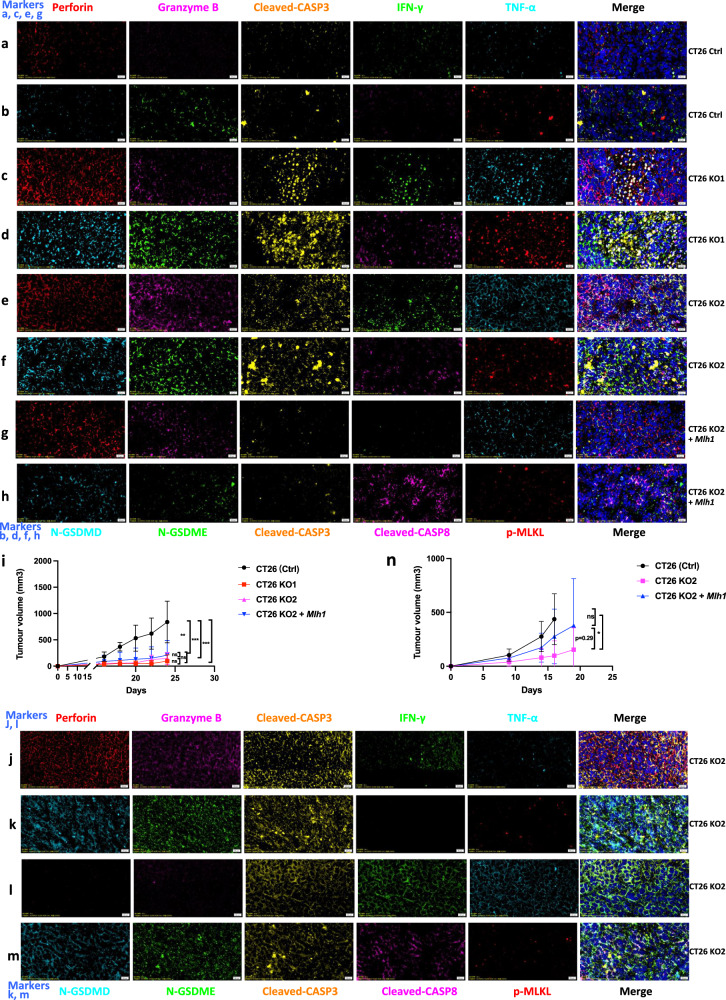
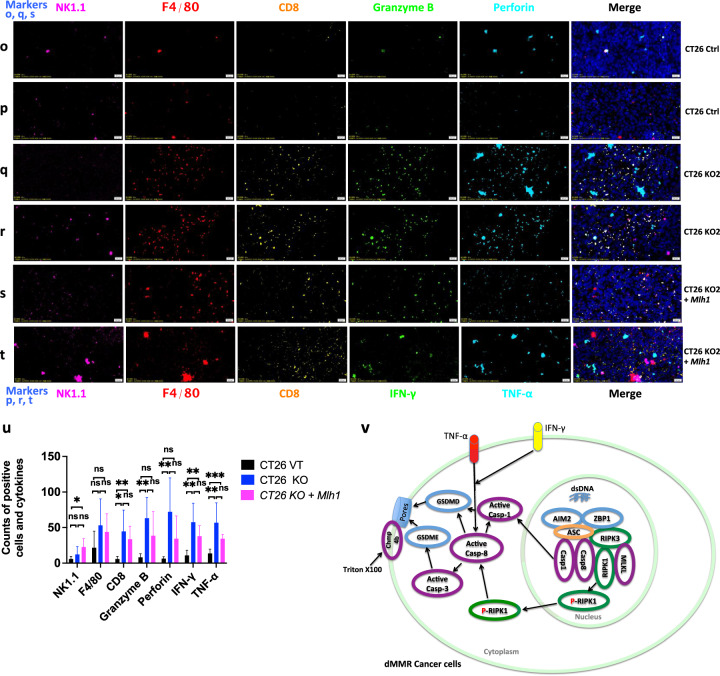
Fig. 13. Immune microenvironment in tumors generated with CT26 (Ctrl), CT26 KO1, CT26KO2, or CT26 KO2 + Mlh1.
a–m, o–t 2 × 10⁵ CT26 (Ctrl), CT26 KO1, CT26KO2, or CT26 KO2 + Mlh1 were injected 180 days after genome editing into syngeneic BALB/c mice at the indicated time points (n = 6) (i); Multiplex immunohistochemistry of Perforin, Granzyme B, Cleaved-CASP3, IFN-γ, TNF-α, and DAPI (a, c, e, g, j, l); N-GSDMD, N-GSDME, Cleaved-CASP3, Cleaved-CASP8, p-MLKL, and DAPI (b, d, f, h, k, m); NK.1.1, F4/80, CD8, Perforin, Granzyme B, and DAPI (o, q, s); NK.1.1, F4/80, CD8, IFN-γ, TNF-α, and DAPI (p, r, t) in the CT26 (Ctrl), CT26 KO1, CT26KO2 or CT26 KO2 + Mlh1 tumor samples from i. The images are representative sections from one mouse. The staining was performed on six independent mice. n 106 CT26 clones were injected into syngeneic BALB/c mice (n = 7). Counts of NK1.1, F4/80, CD8+, Perforin, Granzyme B, IFN-γ, and TNF-α per high-power field from representative fields from each experimental arm (CT26 (Ctrl) group (n = 6), CT26KO2 group (n = 5) and CT26 KO2 + Mlh1 group (n = 4)). Experiments were repeated at least two times. Data are presented as mean ± SEM. Statistical analysis was performed using one-way ANOVA (i, n) and two-tailed unpaired Student’s t-test (u) (*P < 0.05; **P < 0.01; ***P < 0.001; NS, not significant). Ctrl, control. Scale bars, 20 μm. v, Schematic of dsDNA fragments driven hyperactivation of pyroptosis and IFN-γ and TNF-α-induced cell death in dMMR cancer cells.


