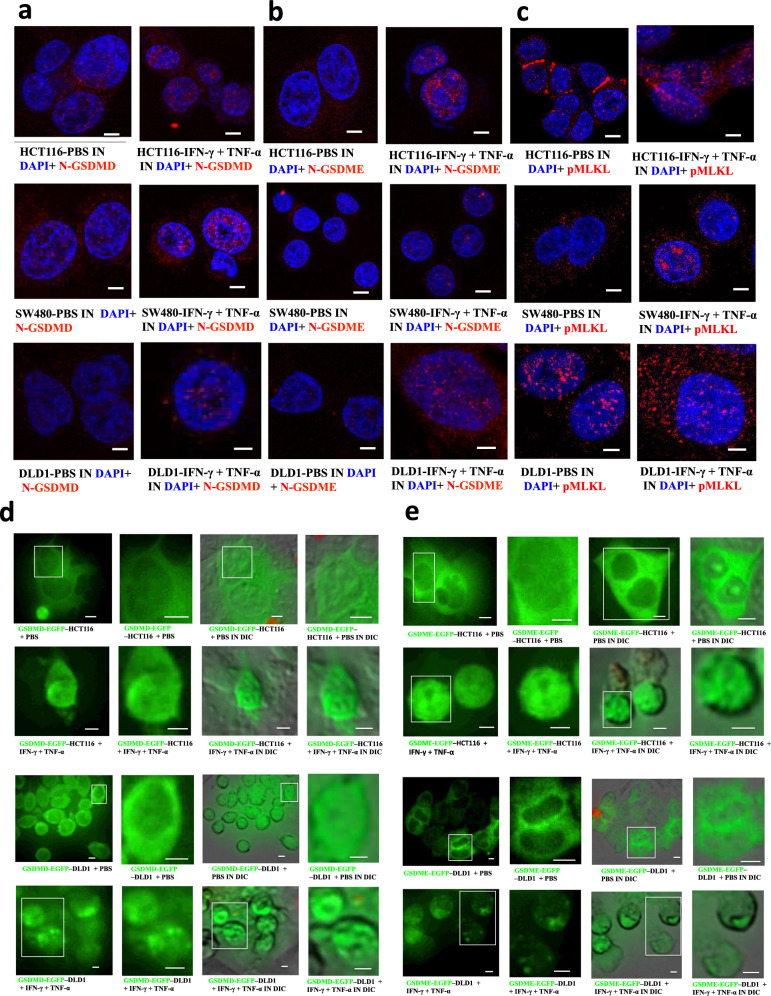
Fig. 9. Location of PANoptotic molecules induced by co-treatment of IFN-γ + TNF-α using immunofluorescence and time-lapse confocal microscopy.
Fixed-cell microscopy images of NT-GSDMD(red), NT-GSDME(red), p-MLKL (red) in HCT116, SW480, DLD1 treated with PBS or IFN-γ + TNF-α (a, b, c) and time-lapse confocal images of either GSDMD-EGFP–expressing or GSDME-EGFP–expressing DLD1 or HCT116 cells after a 24-h PBS or TNF-α + IFN-γ treatment (d, e). Nucleus stained by DAPI (blue), DIC, differential interference contrast. Results are representative of at least three independent experiments. Scale bars, 5 mm.

