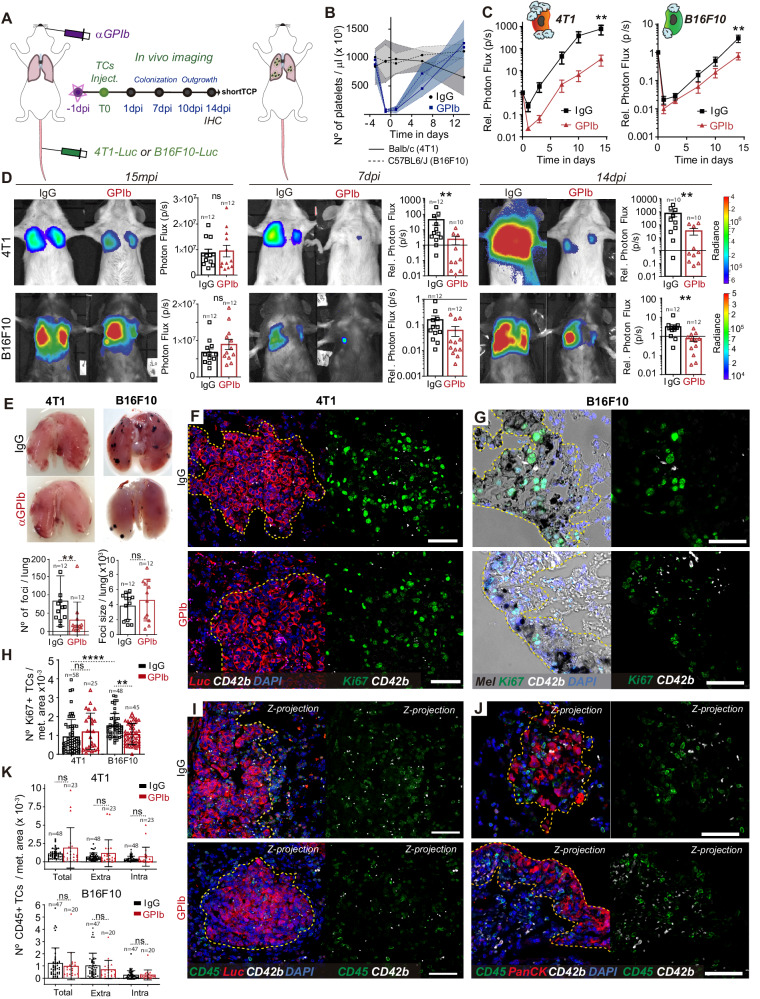
Fig. 3. Long-term TCs metastatic potential is defined by the early TC-Platelet interplay.
A Infographics showing the experimental setting. B Graph showing platelet counts on IgG- and α-GPIb-treated BALB/c and C57BL6/J animals shown as mean ± SD. C Relative bioluminescent kinetics of 4T1-Luc and B16F10-RedLuc TCs lung seeding and outgrowth in IgG and shortTCP mice (n = 12 mice per groups) are shown as mean ± SEM and analyzed using two-way ANOVA with False discovery rate post-test (2 independent experiments were performed), 4T1 q = 0.0022, B16F10 q = 0.0041. D Representative images and timepoint (15mpi, 7dpi, and 14dpi) comparisons of total lung bioluminescence in IgG versus shortTCP animals in 4T1 (up) and B16F10 (down) TCs models. Lung bioluminescence quantifications of n mice (the number of mice analyzed is displayed above the histogram) are shown as mean ± SEM and analyzed using two-sided Mann–Whitney test (2 independent experiments were performed), 4T1 7dpi p = 0.0071, 14dpi p = 0.00889, B16F10 14dpi p = 0.0011. E Macroscopic analysis of mice lungs at 14dpi. Images show IgG and α-GPIb-treated lungs with 4T1 or B16F10 metastatic foci. B16F10 foci number (left) and size (right) quantifications of n mice (n = 12 per group, also displayed above the histogram) are shown as mean ± SD and analyzed using two-sided Mann–Whitney test (2 independent experiments were performed), p = 0.0017. F, G Representative images from paraffine-stained IgG and shortTCP BALB/c-4T1 lungs (F) and C57BL6/J-B16F10 (G) at 14dpi probed against the proliferation marker Ki67 (green) and the platelet receptor CD42b (white). Scale bar: 50 μm. H Number of Ki67+ cells (number of images analyzed are displayed above the histogram) per metastatic area defined by α-pan-cytokeratin (4T1, F) staining or intrinsic melanin expression (B16F10, G) are shown as mean ± SD and analyzed using Kruskal–Wallis with False discovery rate post-test (two independent experiments were performed), q = 0.0001 and q = 0.0095. I, J Representative images from paraffin-stained IgG and shortTCP BALB/c-4T1 (I) and C57BL6/J-B16F10 (J) lungs at 14dpi probed against the hematopoietic lineage marker CD45 (green) and the platelet receptor CD42b antibodies (white). Scale bar: 50 μm. K Total, intra-metastatic, and extra-metastatic number of CD45+ cells (number of images analyzed are displayed above the histogram) per metastatic area defined by α-Luc (4T1, I) or α-pan-cytokeratin staining (B16F10, J) are shown as mean ± SD and analyzed using Mann–Whitney test (2 independent experiments were performed). Source data are provided as a Source Data file.

