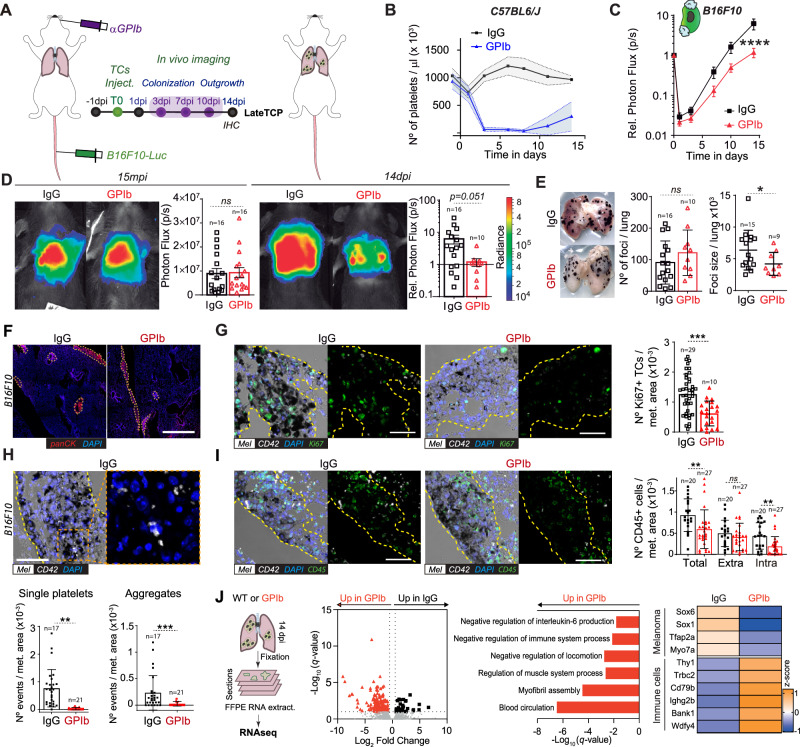
Fig. 5. Platelets significantly influence the late outgrowth of B16F10 metastatic foci but not 4T1 ones.
A Infographics of the experimental scheme. B Graph of platelet counts of IgG- and α-GPIb-treated animals are shown as mean ± SD. C Relative bioluminescence kinetics of B16F10-RedLuc TCs lung seeding and outgrowth in IgG and late TCP mice (n = 16 per group) are shown as mean ± SEM and analyzed using two-way ANOVA with False discovery rate post-test (2 independent experiments were performed), p = 0.0001. D Representative images and timepoint comparisons (15mpi and 14dpi) of total lung bioluminescence in control versus late TCP animals in B16F10 TCs models. Lung bioluminescence quantifications of n mice (the number of mice analyzed is displayed above the histogram) are shown as mean ± SD and analyzed using two-sided Mann–Whitney test (2 independent experiments were performed), 14dpi p = 0.0513. E Macroscopic analysis of mice lungs at 14dpi. Images show IgG- and α-GPIb-treated lungs with B16F10 metastatic foci (number of mice analyzed per group are displayed above the histogram). B16F10 foci number and mean foci size are presented as mean ± SD and analyzed using two-sided Mann–Whitney test (2 independent experiment were performed), foci size p = 0.0401. F Low magnification confocal images of lung metastases defined by pan-cytokeratin staining at day 14 post injection. Scale bar: 500 μm. G–I Immunohistochemical analysis of IgG and late TCP mice lungs at 14dpi. G Representative images of lung sections from IgG and late TCP B16F10 probed against the proliferation marker Ki67 (green), the platelet receptor CD42b (white) and intrinsic melanin expression (black). Scale bar: 50 μm. Total number of images analyzed are displayed above the histogram. Number of Ki67+ cells per metastatic area are shown as mean ± SD and analyzed using two-sided Mann–Whitney test (2 independent experiments were performed), p = 0.0097. H Representative images of lung sections from IgG and late TCP B16F10 probed against the platelet receptor CD42b (white). Scale bar: 50 μm. Total number of images analyzed are displayed above the histograms. Single platelet (≤3) and platelet aggregates (>3) per metastatic area are shown as mean ± SD and analyzed using two-sided Mann–Whitney test (2 independent experiments were performed), single p = 0.0065, aggregates p = 0.0002. I Representative images of lung sections from IgG and late TCP B16F10 probed against the hematopoietic lineage marker CD45 (green), the platelet receptor CD42b (white), and intrinsic melanin expression (black). Scale bar: 50 μm. Total number of images analyzed are displayed above the histogram. Total, intra-metastatic, and extra-metastatic number of CD45+ cells per metastatic area defined by melanin are shown as mean ± SD and analyzed using Mann–Whitney analysis (2 independent experiments were performed), total p = 0.0016, intra p = 0.0058. J FFPE-RNASeq analysis. From the left: representative infographics of the experimental scheme; volcano plot of genes differentially regulated in IgG and α-GPIb-treated mice; GO terms assignment of α-GPIb-derived samples upregulated genes; z scoring comparing IgG and α-GPIb samples for selected genes. Data are representative of three mice per group from two independent experiments. Source data are provided as a Source Data file.

