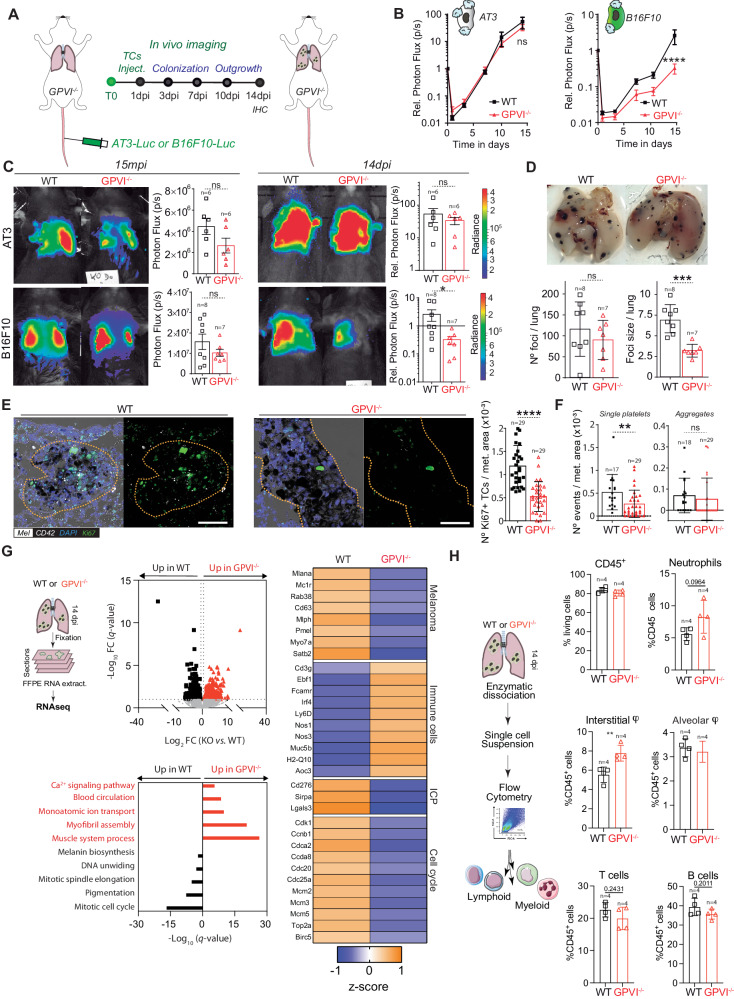
Fig. 6. GPVI receptor-mediated platelets’ metastatic outgrowth effect.
A Infographics showing the experimental setting. B Relative bioluminescence kinetics of AT3-RedFluc-L2 and B16F10-RedLuc TCs lung seeding and outgrowth in WT and GPVI−/− mice (n = 6 mice per group for AT3, n = 7 or 8 respectively for WT or GPVI−/− group for B16F10) are shown as mean ± SEM and analyzed using two-way ANOVA with False discovery rate post-test (1 experiment was performed), B16F10 q = 0.0001. C Representative images and timepoint comparisons (15mpi, left; 14dpi, right) of total lung bioluminescence in WT versus GPVI−/− depleted animals in AT3 (up) and B16F10 (down) TCs models. Lung bioluminescence quantifications of n mice (the number of mice analyzed is displayed above the histogram) are shown as mean ± SD and analyzed using two-sided Mann–Whitney test (1 experiment was performed), B16F10 14dpi p = 0.0289. D Macroscopic analysis of mice lungs injected with B16F10 cells at 14dpi. Pictures of WT (left) and GPVI−/− (right) lungs are show. B16F10 foci number and size are shown as mean ± SD and analyzed using two-sided Mann–Whitney test (1 experiment was performed, number of mice analyzed per group are displayed above the histogram), foci size p = 0.003. E Representative zoomed images of the immunohistochemical analysis of lung tissue sections of WT and GPVI−/− mice probed against the proliferation marker Ki67 (green), the platelet receptor CD42b (white), and intrinsic melanin expression (black). Scale bar: 50 μm. Total number of lung sections analyzed is displayed above the histogram. Number of Ki67+ cells per metastatic area are shown as mean ± SD and analyzed using two-sided Mann–Whitney test (1 experiment was performed), p = 0.0001. F Number of intra-metastatic platelets (from E, total number of lung sections analyzed are displayed above the histogram) per metastatic area in WT and GPVI−/− animals are shown as mean ± SD and analyzed using two-sided Mann–Whitney test (1 experiment was performed), p = 0.0045. G FFPE RNASeq analysis. From the left: representative infographics of the experimental scheme; volcano plot of genes differentially regulated in WT and GPVI−/−; GO terms assignment of WT and GPVI−/− upregulated genes; z-scoring comparing WT and GPVI−/− samples for selected genes. Data are representative of 3 mice per group from 2 independent experiments. H Ex vivo lungs immunophenotyping. Left: Infographics describing the experimental scheme. Right: percentage of relative immune cells populations as assessed by flow cytometry analysis 14dpi. Data are represented as mean ± SD and analyzed using two-sided Student test (n = 4 mice per group, 1 experiment was performed, interstitial macrophage p = 0.0078). Source data are provided as a Source Data file.

