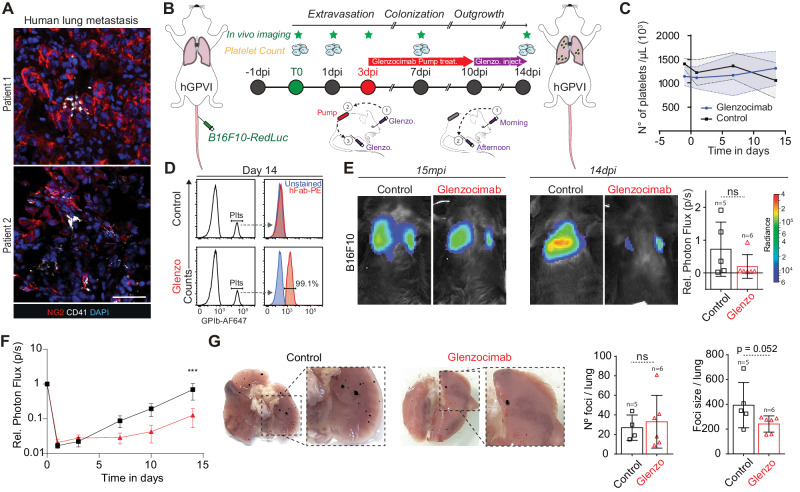
Fig. 7. Therapeutic targeting of the human GPVI receptor impairs metastatic outgrowth of established foci.
A Representative confocal images of human biopsies from melanoma metastases (patient1 and patient2) probed against the melanoma marker NG2 (red) and the platelet marker CD41 (white). Scale bar: 50 μm. B Infographics showing the experimental setting. Glenzocimab administration is performed via subcutaneous osmotic pumps from 3dpi to 10 dpi (red arrow) then continued by morning retro-orbital (1) and afternoon intra-peritoneal (2) injection until 14dpi. C Graph showing platelet counts in control and Glenzocimab-treated animals (n = 5 mice in the control group, n = 6 in the Glenzocimab group) and shown as mean ± SD. D Flow cytometry analysis of mouse platelets labeled ex vivo. Left: electronic gating strategy on platelets labeled with α-GPIb-647. Right: ex vivo platelets staining with anti-human (Fab)–PE-labeled antibody at 14dpi. E Representative images and timepoint (15mpi and 14dpi) comparisons of total lung bioluminescence in control versus Glenzocimab-treated animals. Day 14 lung bioluminescence quantifications of n mice (the number of mice analyzed are displayed above the histogram) are shown as mean ± SD and analyzed using two-sided Mann–Whitney test (2 independent experiments were performed). F Relative bioluminescence kinetics of B16F10-RedLuc TCs lung seeding and outgrowth in isotype or glenzocimab-treated mice (n = 5 mice in the control group, n = 6 in the Glenzocimab group) are shown as mean ± SEM and analyzed using two-way ANOVA with False discovery rate post-test (2 independent experiments were performed), q = 0.0007. G Macroscopic analysis of lungs from mice injected with B16F10 cells at 14dpi. Pictures of control (left) and glenzocimab-treated (right) lungs are shown. B16F10 foci number and size are shown as mean ± SD and analyzed using two-sided Mann–Whitney test (2 independent experiments were performed, number of mice analyzed per group is displayed above the histogram). Source data are provided as a Source Data file.

