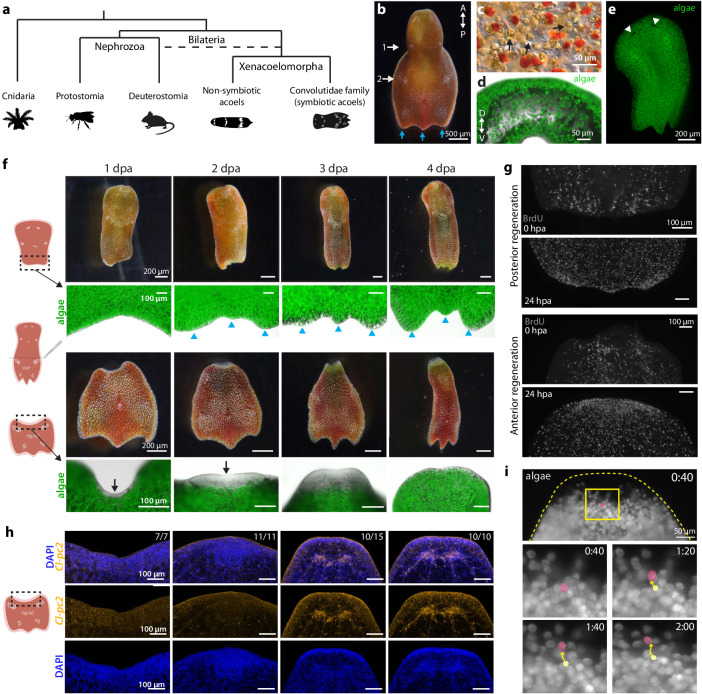
Fig. 1. Acoel regeneration involves both acoel and algal cells.
a Schematic of a simplified phylogeny showing the position of symbiotic acoels, which belong exclusively to the Convolutidae family. The position of the Xenacoelomorpha is still debated92 as a basal bilaterian or a sister group to Ambulacrarians (dotted line). b Photograph of the acoel C. longifissura. Numbers mark the pairs of white concrement granules and blue arrows point to the three tail lobes. c Differential interference contrast image showing the acoel cells (transparent and red cells) intermingled with green-brown algal cells (a few examples are highlighted by arrows). d Transverse section at the second concrement granule pair showing the distribution of algae (green) along the animal dorsal ventral axis (D-V), imaged through autofluorescence at 647 nm. e Algal cells are ubiquitously distributed across the host body, except the eye spots (arrowheads), which are devoid of algae. f Regeneration from posterior and anterior facing wounds. Top: posterior regeneration, with blue arrowheads indicating the regenerated tail lobes. Bottom: anterior regeneration with black arrows pointing at the blastema. Note the new tissue is devoid of algae until 4 dpa. g BrdU staining of posterior (top) and anterior (bottom) facing wound sites at 0 and 24 hpa. A buildup of BrdU+ cells is visible at the anterior wound at 24 hpa. h Fluorescence in situ hybridization (FISH) of the neuronal marker prohormone convertase 2 (Cl-pc2) and nuclei staining with DAPI at various time points post-amputation. The blastema formation is evident by the accumulation of cells at 2 dpa based on the DAPI staining. Neural ganglia are regenerated by 3 dpa. Numbers represent animals in which the neural structure is consistent with the figure out of the total number of animals examined. i Snapshots showing algal motions at the boundary of anterior blastema at 3 dpa. Highlighted in magenta is an example of an algal cell moving towards the regenerated tissue. Yellow: original position. Time stamp is shown as minutes:seconds. The corresponding video is available as Supplementary Movie 2. Experiments were repeated at least twice (c, d, g, h) or ten times (e, f). Schematics are created with BioRender.com.

