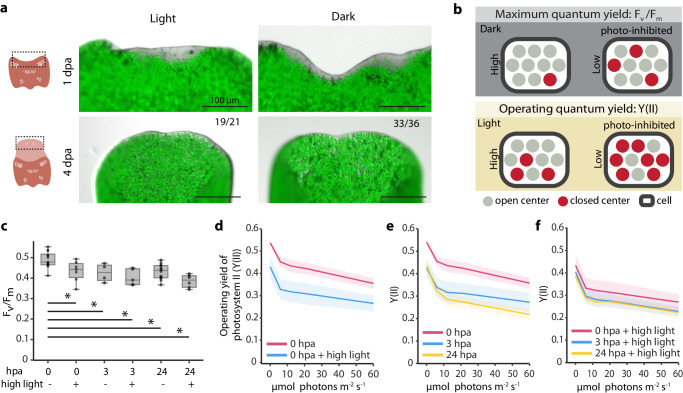
Fig. 2. Photosynthesis is not necessary for regeneration but is affected by amputation.
a Anterior regeneration is consistent in the presence or absence of light at 1 and 4 dpa. Algal cells (green) are imaged at 647 nm. Numbers represent animals which regenerated normally out of the total number of animals examined, experiments were repeated three times. Schematics are created with BioRender.com. b Schematics showing the biological interpretation of Fv/Fm and Y(II). c Box plot showing Fv/Fm of tails at different hpa, with or without light stress. For 0 hpa, samples were dark acclimated and then amputated under green light. Experiments contain 13 (0 hpa), 4 (3 hpa), 12 (24 hpa), 5 (3 hpa + light stress), 6 (0 hpa + light stress), and 7 (24 hpa + light stress) biological replicates, respectively. Boxes: upper and lower quartiles with the median marked by the middle line, whiskers: upper and lower fences, dots: individual replicates. All individual treatments are significantly different compared to ‘0 hpa’, with no significance between any other conditions (one-way ANOVA, p = 6.53e–5). *Tukey post hoc test, 0 hpa vs: 0 hpa + light stress, p-adj = 0.054; 3 hpa, p-adj = 0.083; 3 hpa + light stress, p-adj = 0.003; 24 hpa, p-adj = 0.001; 24 hpa + light stress, p-adj = 0.0096. Y(II) measurements at increasing actinic light intensities with and without light stress (d), at different time points post amputation without light stress (e), or exposed to 24 h high light before amputation (f). Experiments contain 3 (0 hpa), 4 (3 hpa), 5 (24 hpa), 7 (0 hpa + light stress), 3 (hpa + light stress), and 6 (24 hpa + light stress) biological replicates, respectively. Lines: mean; shaded regions: one standard deviation above or below. Each biological replicate consisted of 20 tails (c–f). Source data are provided as a Source Data file.

