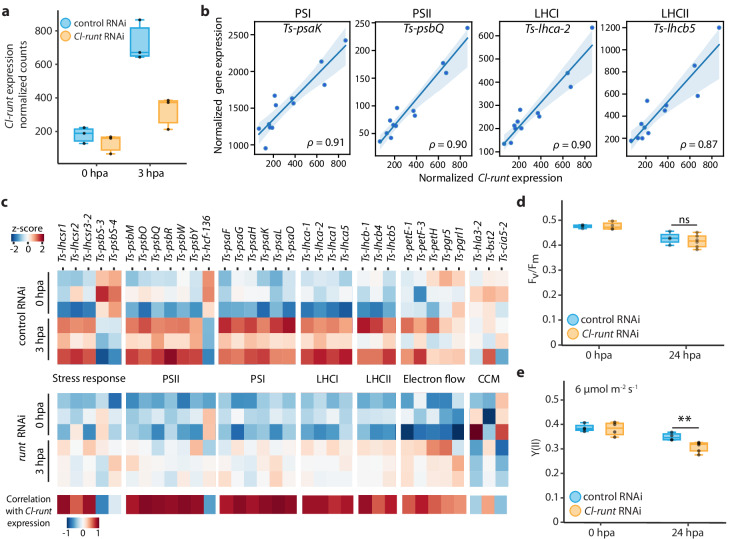
Fig. 6. Cl-runt affects transcription of photosynthetic related genes and photosynthetic efficiency.
a Expression of Cl-runt at 0 and 3 hpa in control (blue) and Cl-runt (yellow) RNAi animals, with three replicates shown by dots. b Normalized expression of select photosynthesis genes vs Cl-runt normalized counts. Each dot represents a sample from the RNA-seq experiment. Replicates are shown as dots, lines represent the linear regression, and shaded regions are the confidence interval of the regression. ρ: Spearman correlation. The examples are chosen to represent components of PSI, PSII, LHCI, LHCII, and PET, respectively. c Left: heatmap reporting z-scores from triplicates of selected genes involved in the light reactions of photosynthesis, alternative electron flows, and CCM that are differentially expressed at 3 hpa in Cl-runt RNAi vs control RNAi, or highly correlated with Cl-runt expression. Bottom: correlation of the given gene with Cl-runt expression. d Fv/Fm measured at 0 and 24 hpa in Cl-runt RNAi and control tails. There is a similar decrease in both Cl-runt RNAi and controls after 24 hpa. e Y(II) of Cl-runt RNAi and control tails at 0 and 24 hpa with 6 µmol photon m−2 s−1 of actinic background light. Both Cl-runt RNAi and controls show a decrease in Y(II) at 24 hpa compared to their counterparts at 0 hpa. Y(II) of Cl-runt RNAi at 24 hpa compared to control RNAi is significantly reduced (**p = 0.011, ns not significant, two tailed t-test). For (d, e) each treatment consisted of four biological replicates, and each replicate contained twenty tails. Boxes represent upper and lower quartiles with the median marked by the middle line, the bars represent the upper and lower fences. Source data are provided as a Source Data file.

