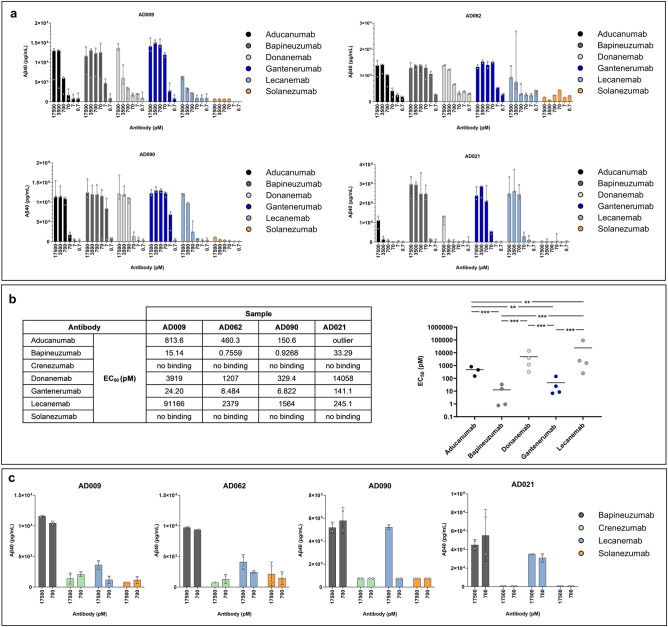
Figure 5.
IP analysis of CAA Aβ fibrils extracted from AD leptomeningeal tissues. CAA Aβ fibrils were isolated from the indicated four AD subjects and IP was conducted using the indicated antibody concentrations before eluate analysis using the V-PLEX® Aβ peptide panel 1 (4G8) kit. (a) Eluate Aβ40 levels are presented as the median ± range, with each open circle representing an individual experiment. (b) The estimated EC50 values for each individual and antibody (left-hand panel) and comparison of mean EC50 values for the indicated antibodies (right-hand panel). A statistically significant ANOVA (F4.8 = 58.93, p = 0.00001) was followed by Tukey’s unequal N post-hoc testing; **p < 0.01, ***p < 0.001. (c) Eluate Aβ40 levels (mean ± SD), with each open circle representing an individual experiment.

