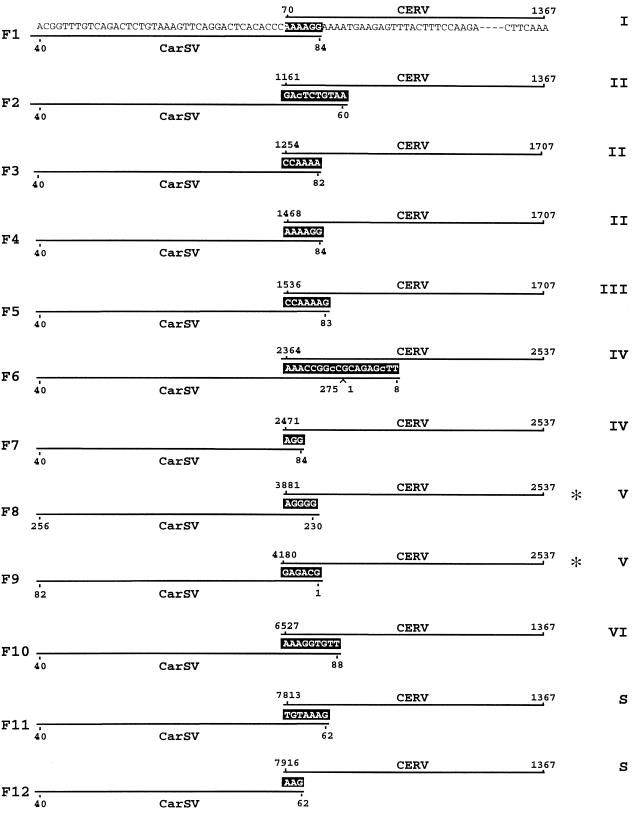
FIG. 3.
Schematic representation of the sequences flanking several CarSV-CERV DNA junctions. CarSV and CERV sequences are shown in F1 and are represented by solid lines in the rest of the sequences shown, and nucleotides common to both sequences are indicated with white letters on a black background. Nucleotide changes in the CarSV sequence are in lowercase type. Numbers refer to nucleotide positions relative to the CarSV-0 RNA and CERV DNA sequences, respectively, excluding those corresponding to primers used for PCR amplification. Asterisks mark junctions identified previously (5). Roman numerals at the right indicate CERV ORFs, and the long viral intergenic region between ORFI and ORFVI is denoted by the letter S.

