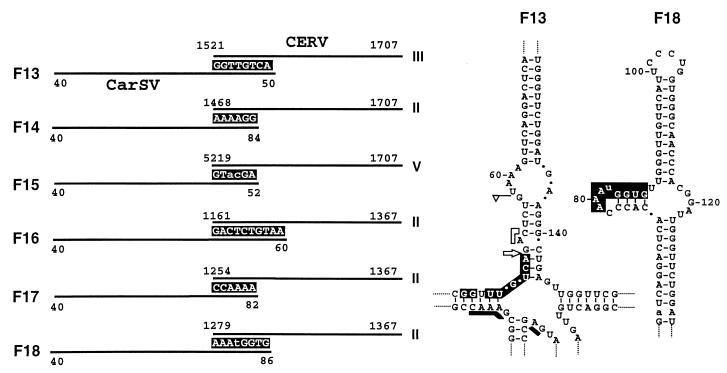
FIG. 6.
(Left) Schematic representation of the sequences flanking several CarSV-CERV DNA junctions from virus-free plants around the junction sites. CarSV and CERV sequences are indicated by solid lines, and nucleotides common to both sequences are shown as white letters on a black background. Nucleotide changes in the CarSV sequence are in lowercase type. Other details are as described in the legend to Fig. 3. (Right) Portion of the secondary structure proposed for CarSV-0 RNA (Fig. 1), with the nucleotides involved in the junction corresponding to fusions F13 and F18 depicted as white letters on a black background. Other symbols used are as described in previous figure legends.

