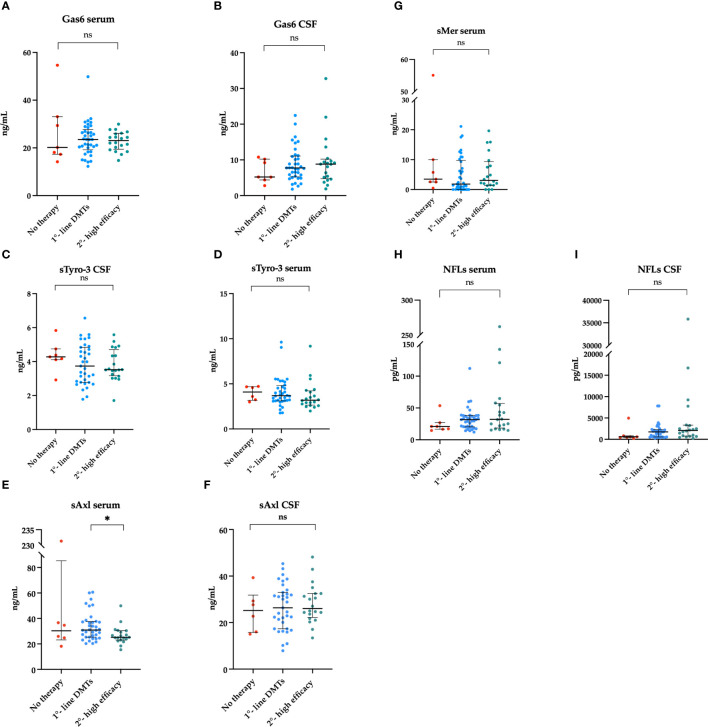
Figure 2.
Association between Gas6 concentration in the serum (A) and CSF (B), sTyro3 concentration in the serum (C) and CSF (D), sAxl concentration in the serum (E) and CSF (F), sMer concentration in the serum (G), NFLs concentration in the serum (H) and CSF (I) and the type of therapy at follow-up visit. Results are shown as medians [IQR]. *p = 0.04, ns, not significant.

