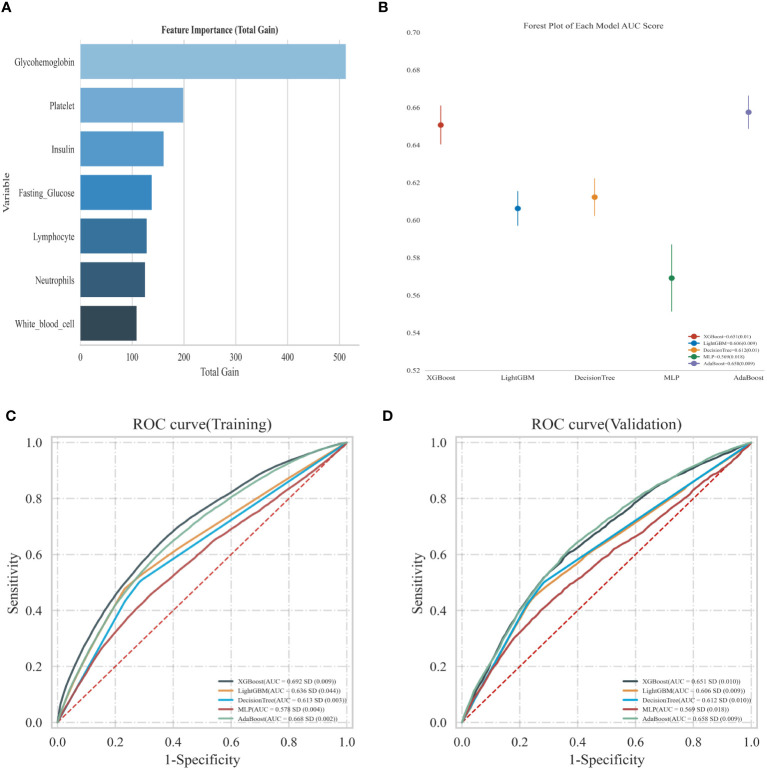
Figure 5.
(A) Using XGBoost model predict the relative importance; (B) Forest map shows the ROC results of OAB prediction by each model; (C) Predicted ROC curve of adverse events in the training sets of the five models; (D) Predicted ROC curve of adverse events in the validation sets of the five models.

