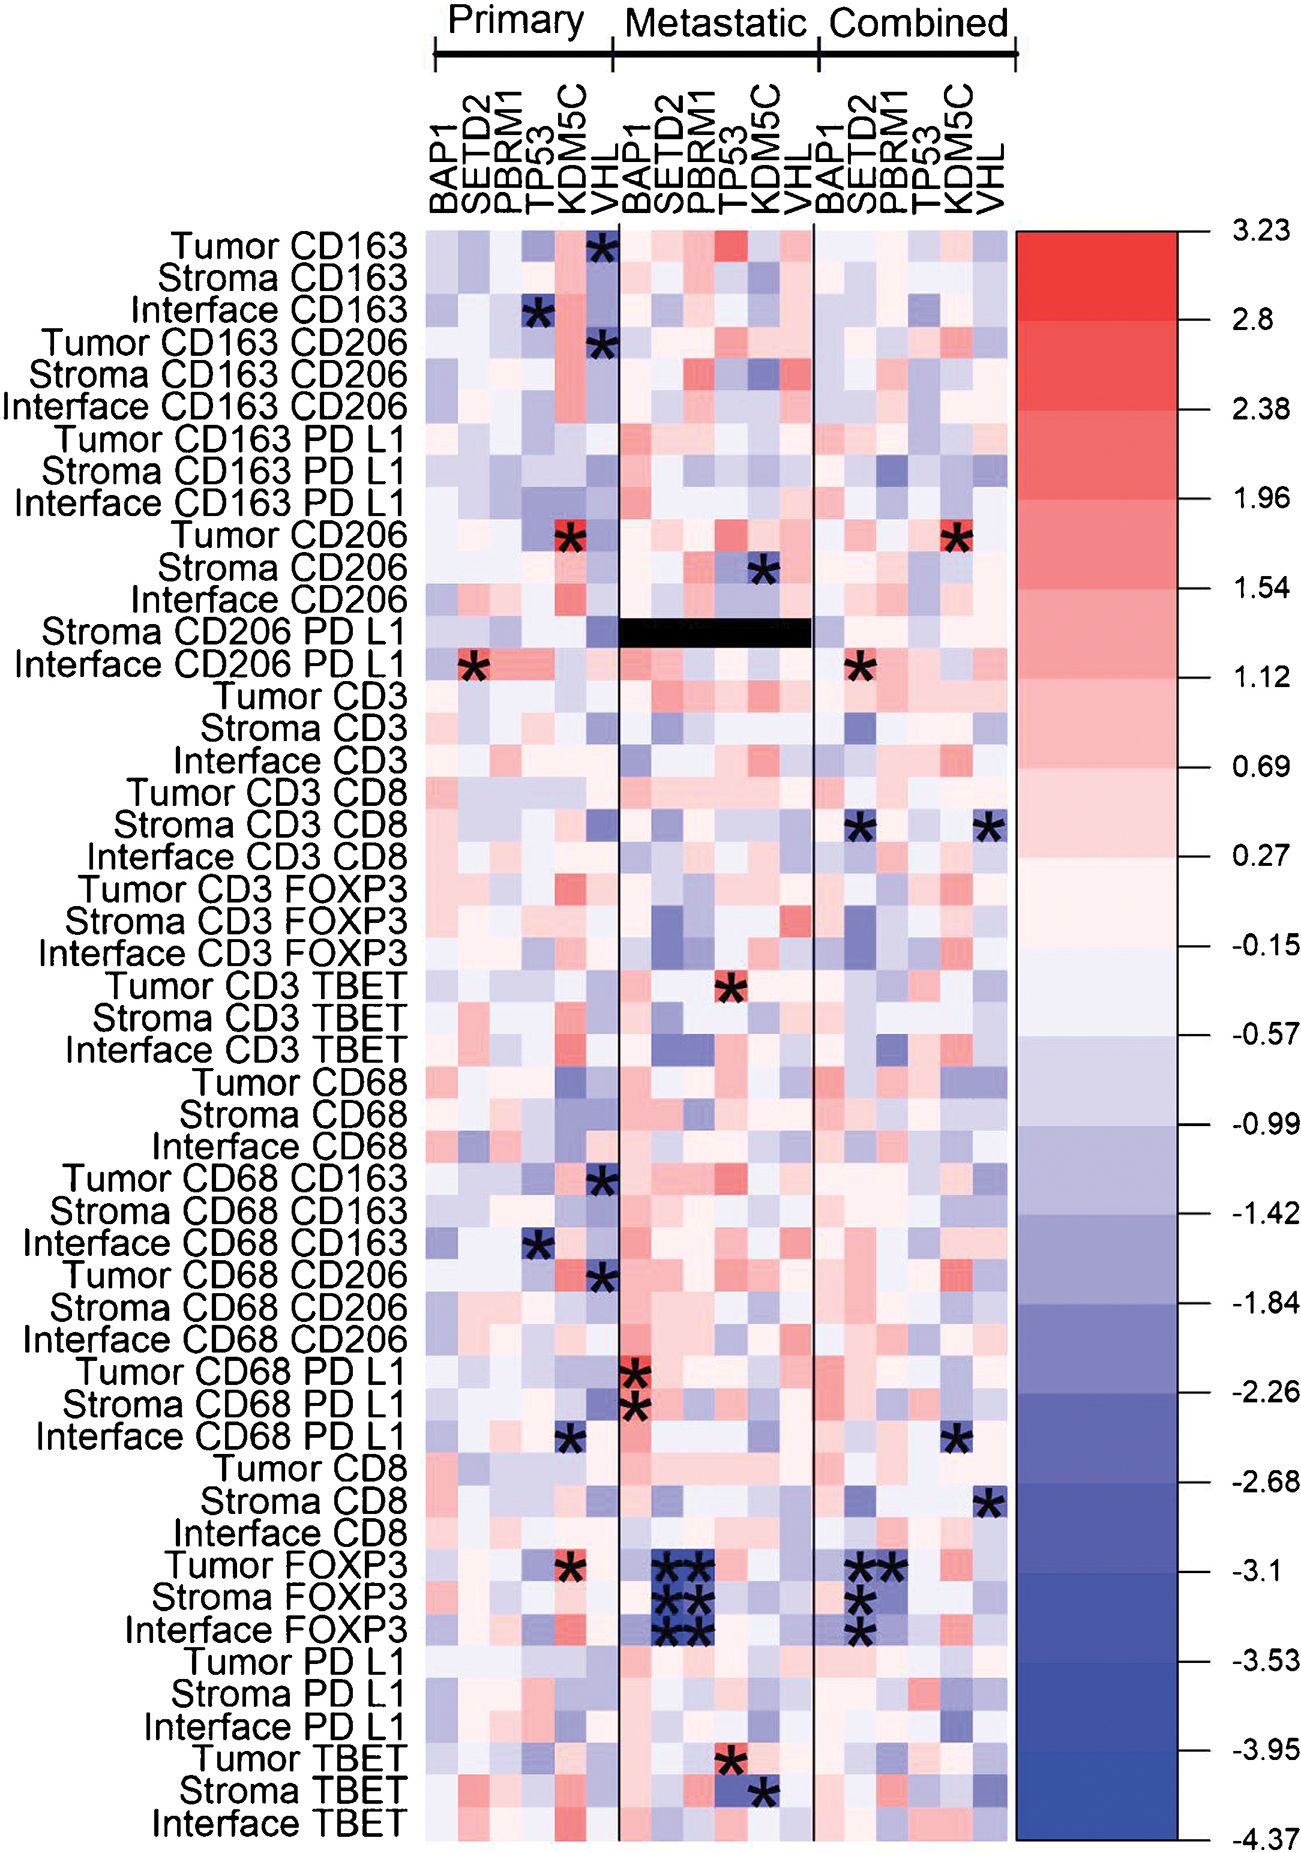
Fig. 3 –

Heat-map diagram of immune cell density for all tumors, and primary and metastatic tumor subgroups. Color gradient represents linear mixed-model coefficients between the somatic mutation subgroups and immune infiltrate density for the cell type and region location listed in the row names (red = higher immune cell density, blue = lower immune cell density). The asterisks represent p < 0.05. Stromal CD206+/PD-L1+ was unable to be assessed for metastatic tumors; too few cells were identified. PD-L1 = programmed death-ligand 1.
