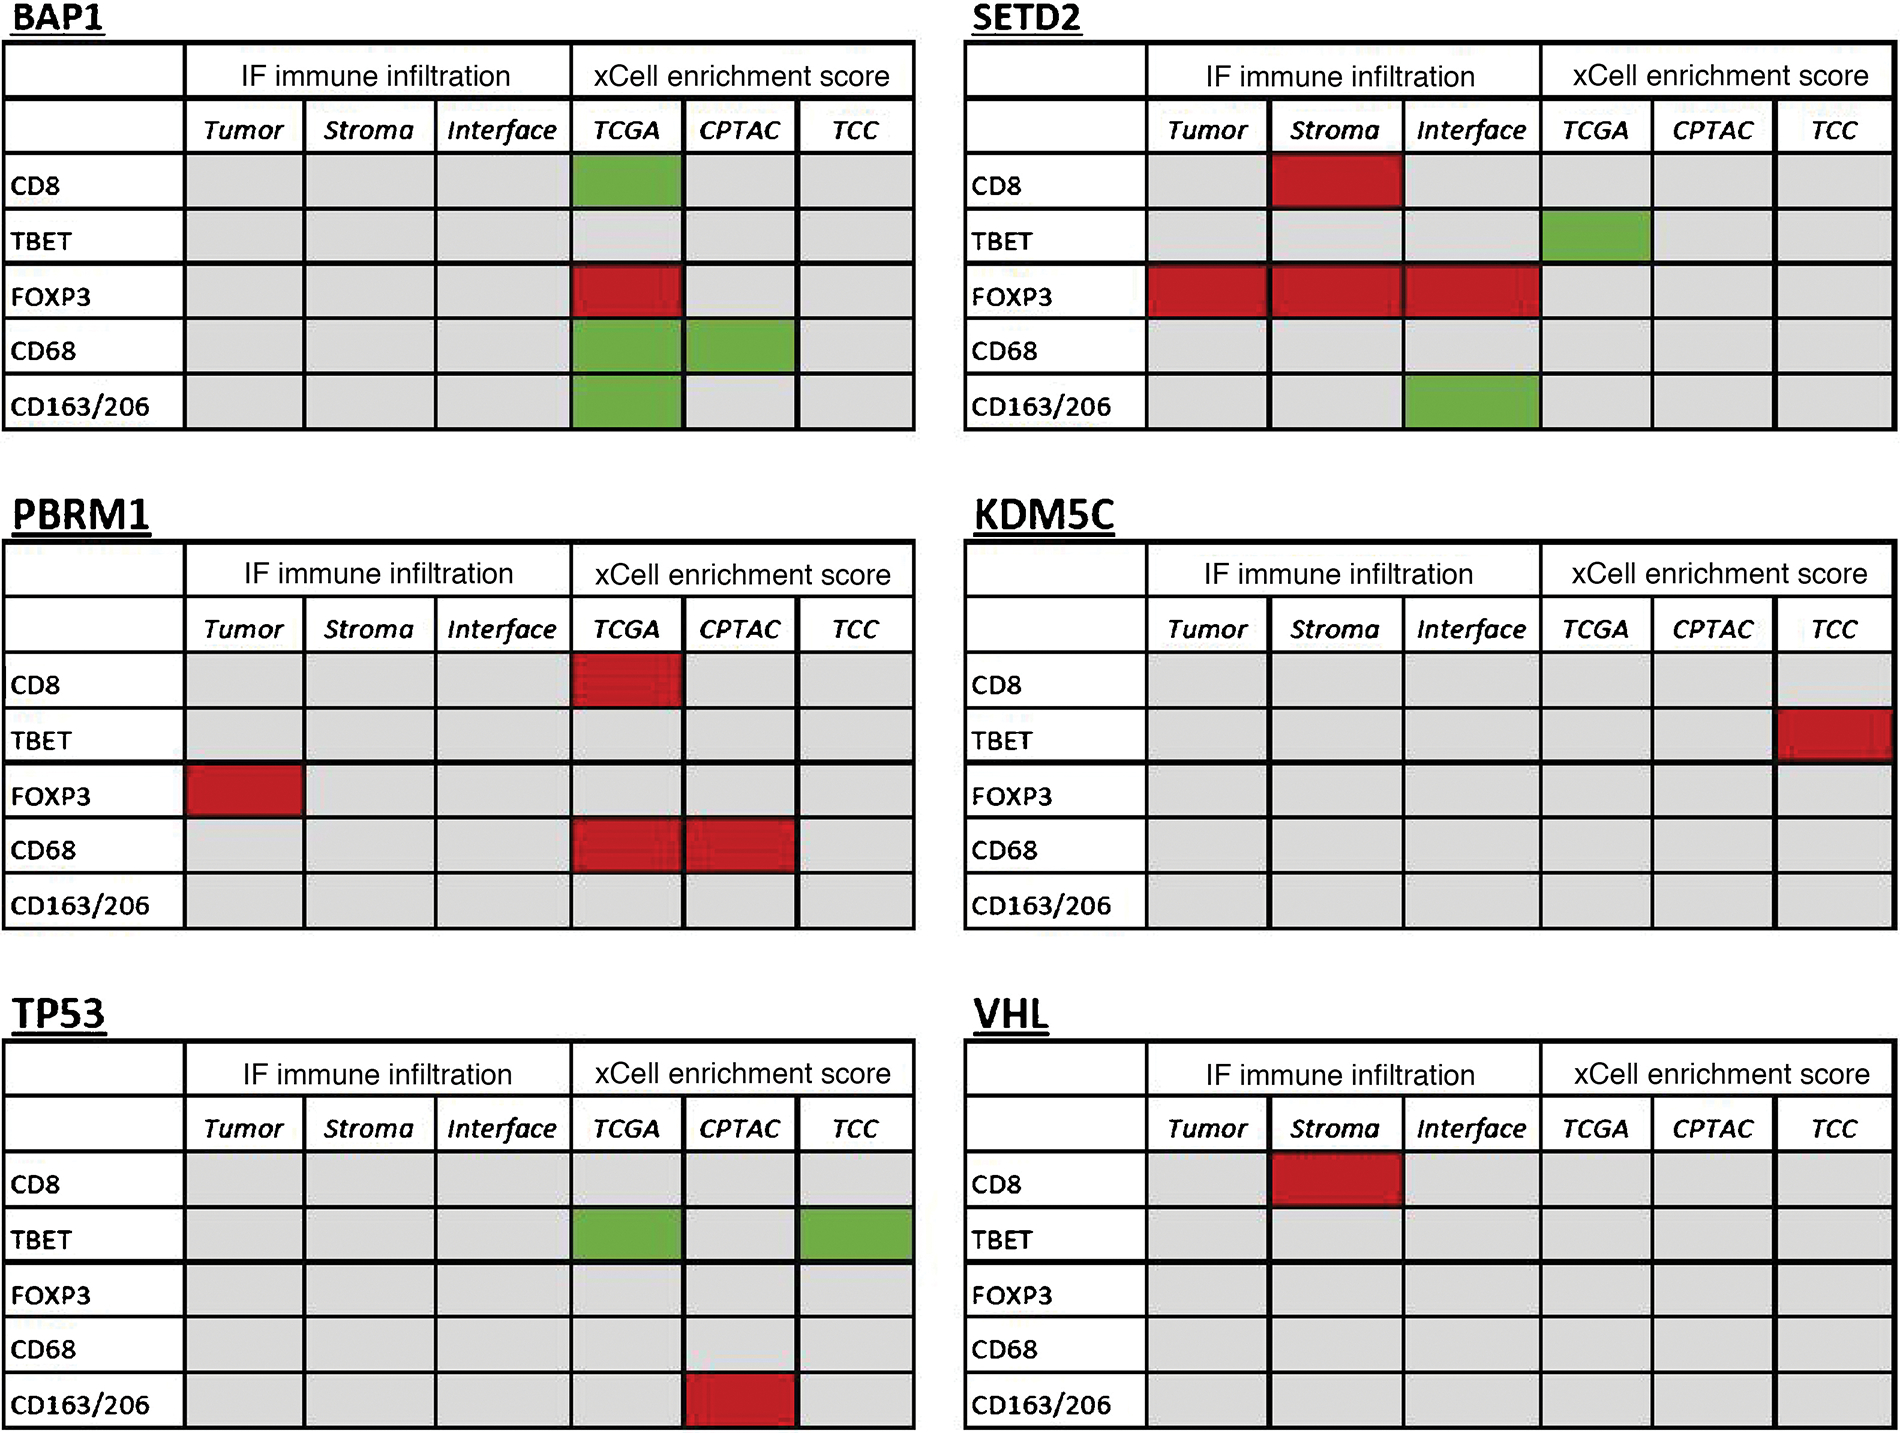
Fig. 5 –

Tables comparing statistically significant findings from the IF-derived immune infiltrate analysis and xCell enrichment scoring, for all tumor samples. Green panels represent increased infiltration or xCell score for mutants, and red panels represent decreased infiltration or xCell score for mutants. CPTAC = Clinical Proteomic Tumor Analysis Consortium; FOXP3 = forkhead box P3; IF = immunofluorescence; TBET = T-box transcription factor TBX21; TCC = Moffitt Cancer Center Total Cancer Care; TCGA = The Cancer Genome Atlas.
