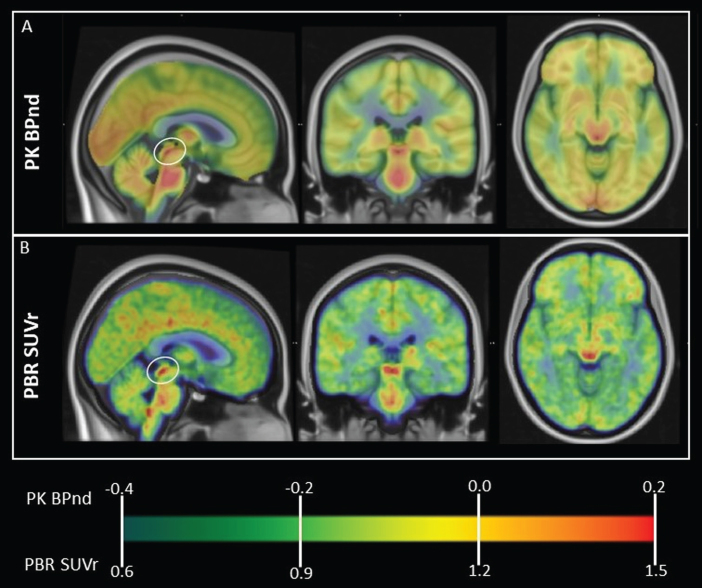
Fig. 1.
Normal, whole-brain pattern of TSPO expression measured using PET. Group average TSPO PET images in MNI space are overlaid onto T1 template MRI. A) PK PET BPnd in 43 healthy subjects. B) PBR28 PET SUVr in 20 healthy subjects. Note prominent high signal in dorsal midbrain colliculi (circled on sagittal view) using both TSPO tracers. High signal is also visible in thalamus and diffusely in midbrain, pons and medulla. MNI coordinates of regions of peak signal are presented in Table 2. Brainstem regions of high signal appear to correspond to multiple nuclei of the reticular formation.

