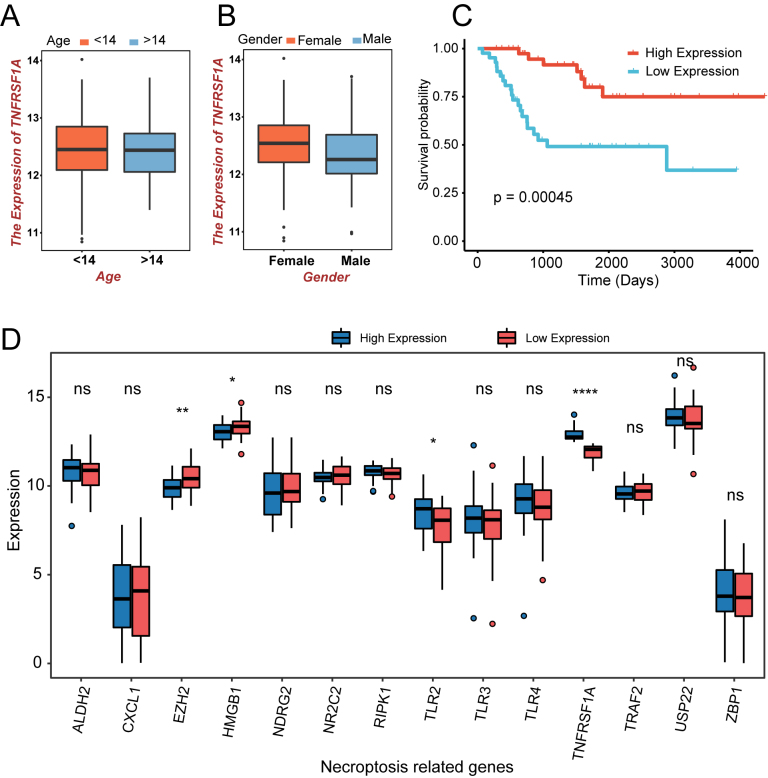
Figure 2.
The expression and prognostic analysis of NRGs in the TARGET-OS cohort. (a) Age-related expression of the TNFRSF1A gene in patients with OS; orange is less than 14 years; blue is greater than 14 years. (b) Expression of TNFRSF1A in different sexes; orange indicates males; blue indicates females. (c) K–M curve in different TNFRSF1A expression groups; orange is the high-expression group; blue is the low-expression group. (d) Box plot of NRGs expression in the two TNFRSF1A expression groups; blue is the high-expression group; red is the low-expression group. ns: 0.05, *P < 0.05, **P < 0.01, ****P < 0.0001.

