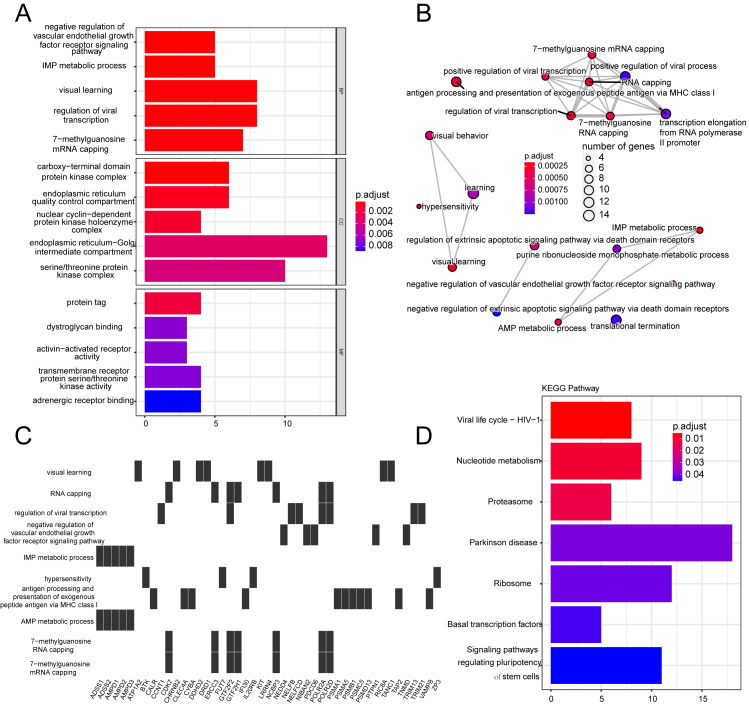
Figure 4.
PPI network analysis for NRGs. (a) PPI network plot for 14 NRGs. (b) Correlation heat map of 14 NRG expressions; points with absolute values of correlation coefficients greater than 0.5 are marked with color. Red represents positive and blue represents negative correlations. (c–d) Expression of 14 NRGs at different expression levels of TNFRSF1A in GSE16091 (c) and GSE21257 (d). ns: 0.05, *P < 0.05, **P < 0.01, ****P < 0.0001.

