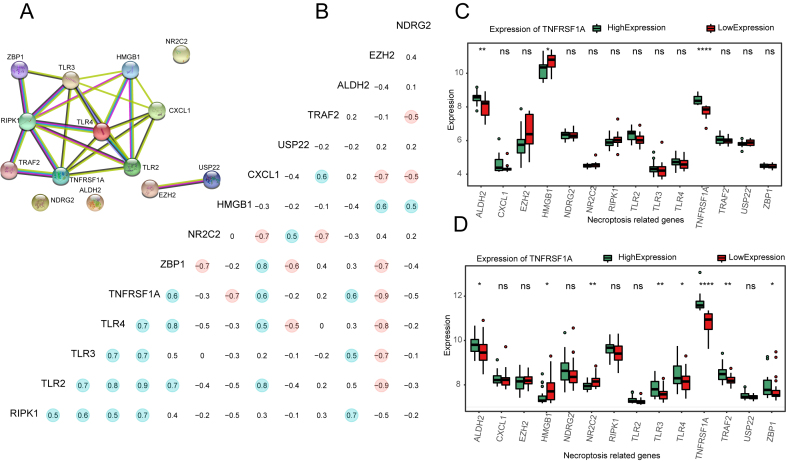
Figure 6.
Effect of TNFRSF1A expression grouping on immunotherapy in three datasets. (a–c) Expression of immune checkpoints CTLA4, LAG3, and TIGIT in the TARGET-OS cohort, GSE16091, and GSE21257 datasets. (d–g) Stromal score (d), immune score (e), estimate score (f), and tumor purity (g) were calculated using the TARGET-OS dataset in both the TNFRSF1A high- and- low-expression groups.

