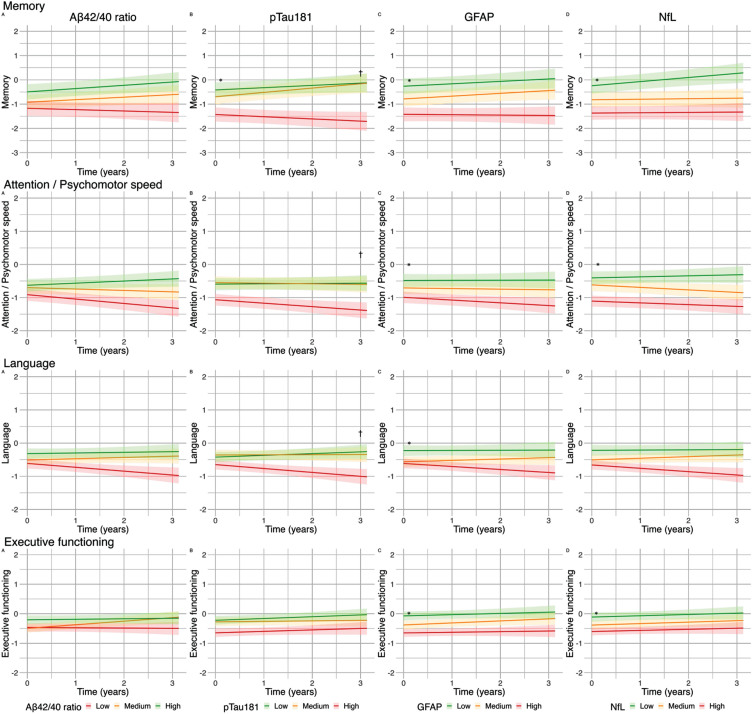
Fig. 2.
Effect of blood-based biomarker in tertiles on cognitive performance (z-scores) in patients with cardiovascular diseases along the heart-brain axis: Lines represent βs for blood-based biomarkers in tertiles of the uncorrected model. A) The green line represents the high tertile of Aβ42/40 concentration, the orange line represents the medium tertile of Aβ42/40 concentration, the red line represents the low tertile of Aβ42/40 concentration. B-D). The green line represents the low tertile of pTau181/GFAP/NfL concentration, the orange line represents the medium tertile of pTau181/GFAP/NfL concentration, the red line represents the high tertile of pTau181/GFAP/NfL concentration. The range of the graph in the memory domain is extended from “2 to –2” to “2 to –3”. *q < 0.05FDR for baseline; †q < 0.05FDR for change over time.

