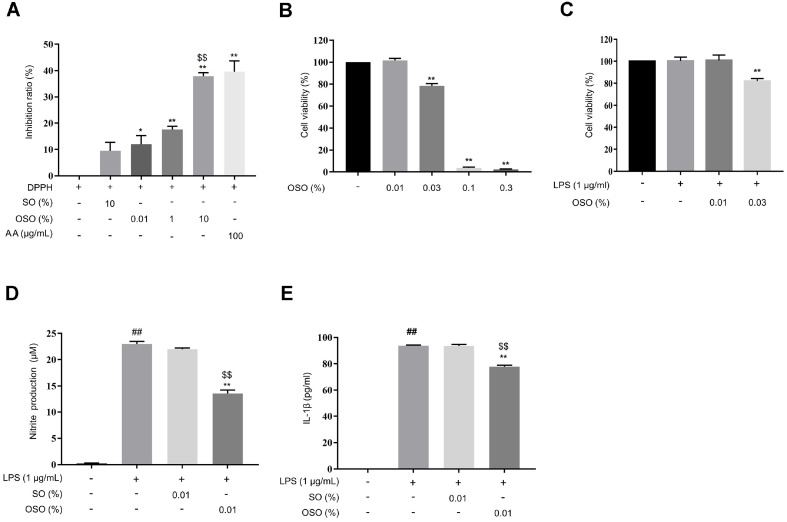
Fig. 1. Anti-inflammatory and antioxidant effects of OSO on LPS-stimulated RAW 264.7 cells.
(A) DPPH radical scavenging activity of OSO at various concentrations. (B-C) Viability of RAW 264.7 cells was measured using a WST-8 assay. The cells were treated with OSO for 24 h (B) or co-treated with OSO and LPS for 24 h (C). (D-E) NO assay and ELISA were performed to determine NO (D) and IL-1β (E) levels in the culture supernatant after treatment with OSO in the presence of LPS for 24 h. The results are expressed as the mean ± SEM (n = 3). *, p < 0.05; **, p < 0.01 compared with DPPH-only. $$, p < 0.01 compared with DPPH+SO (A). **, p < 0.01 compared with control (B). **, p < 0.01 compared with LPS-only (C). **, p < 0.01 compared with LPS-only. $$, p < 0.01 compared with LPS + SO. ##, p < 0.01 compared with the non-treated samples (D–E).

