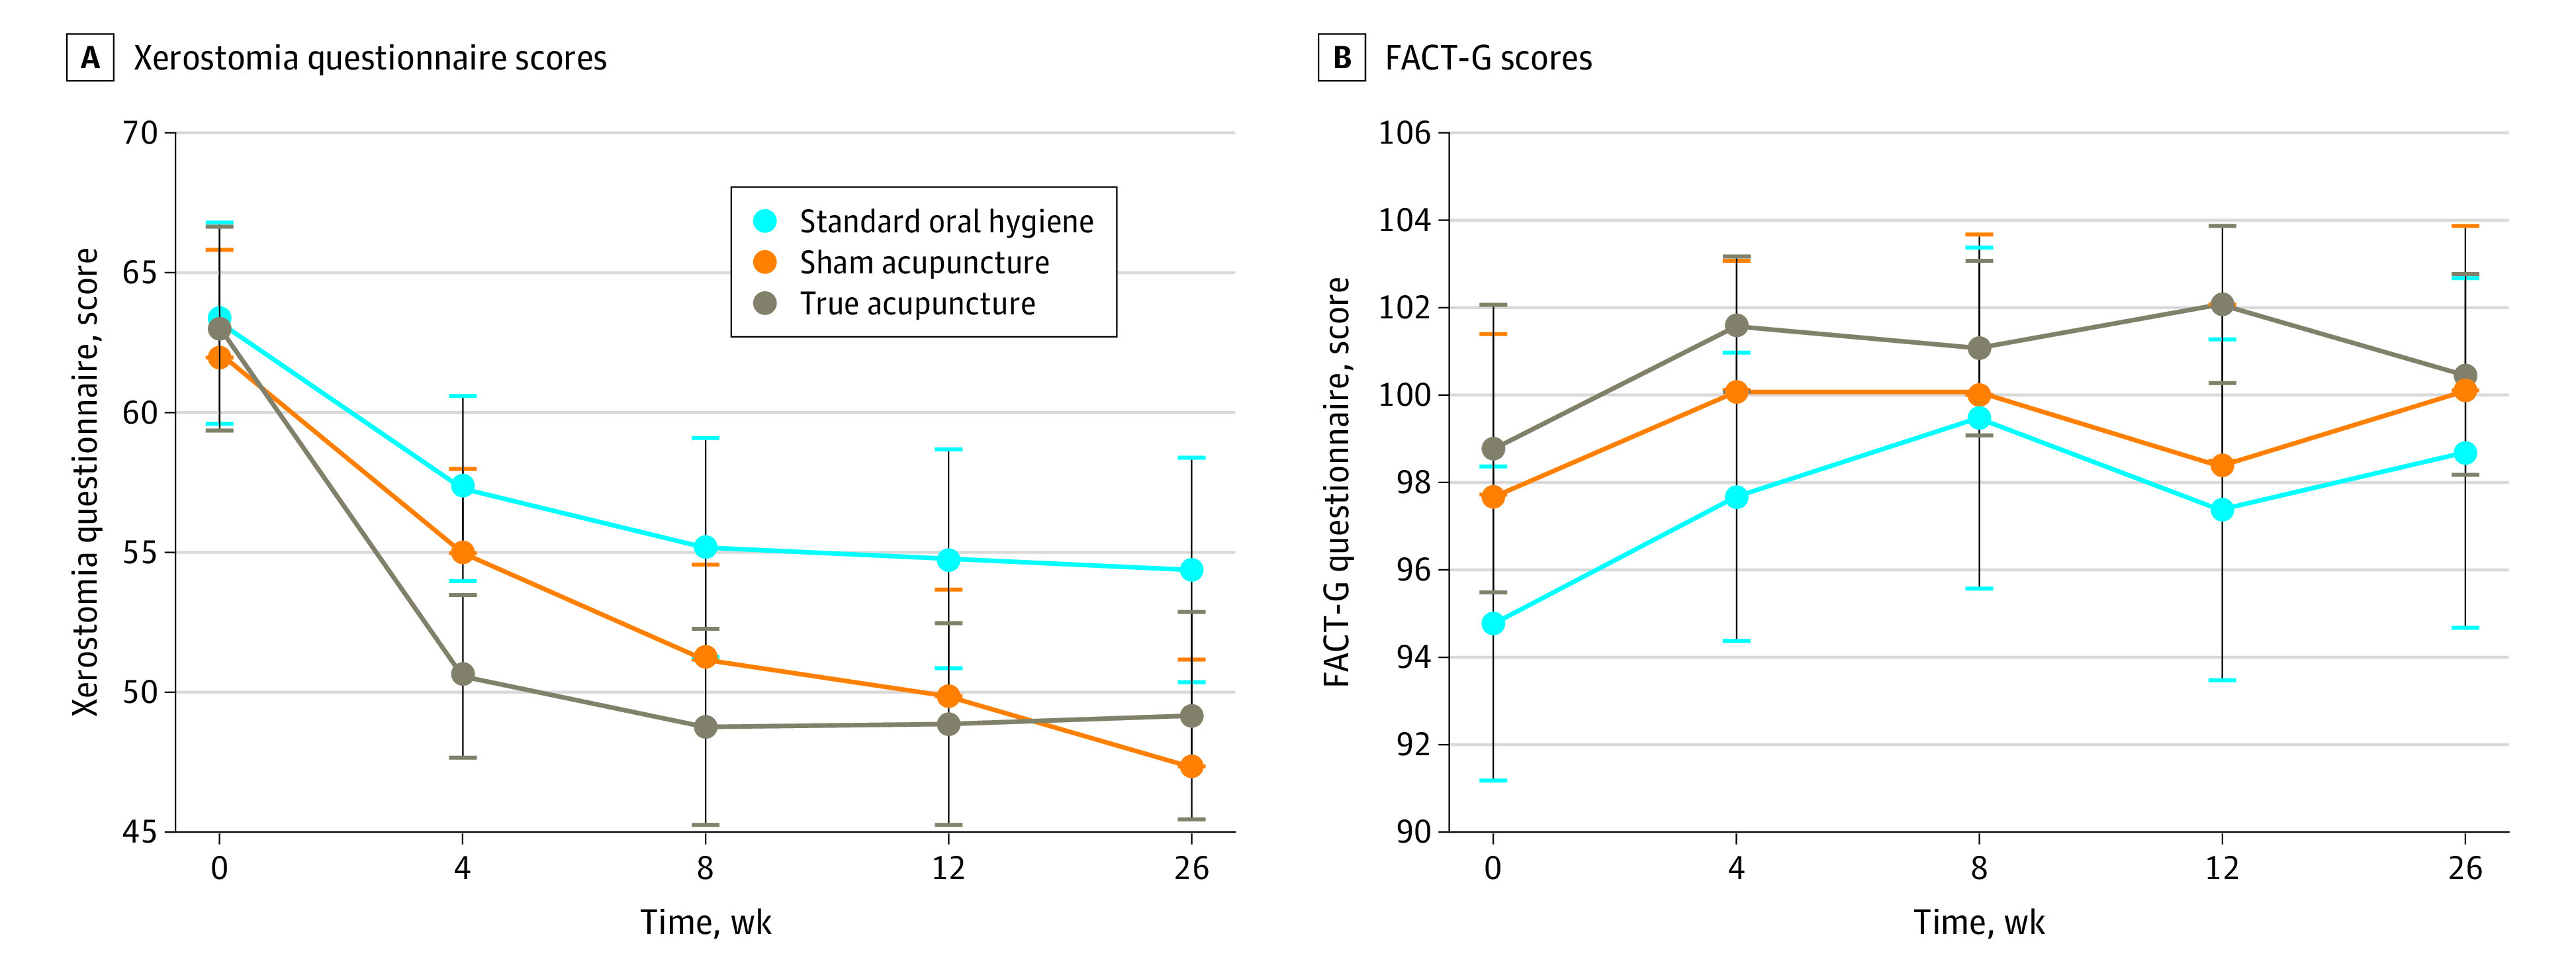
Figure 2. Least Squares Mean Model Estimates for Xerostomia Questionnaire Scores and Functional Assessment of Cancer Therapy–General (FACT-G) Scores by Treatment Group.

A, Least squares mean model estimates for Xerostomia Questionnaire. Unadjusted baseline mean and 95% CIs presented for reference, but adjusted mean and 95% CIs are presented for weeks 4, 8, 12, and 26. There were statistically significant differences between true acupuncture and standard oral hygiene (P = .003) at week 4 and between sham acupuncture and standard oral hygiene at week 26, true acupuncture vs standard oral hygiene at week 8 (P = .02), week 12 (P = .03), and week 26 (P = .06). B, Least squares mean model estimates for FACT-G scores. Unadjusted baseline mean and 95% CIs presented for reference, but adjusted mean and 95% CIs are presented for weeks 4, 8, 12, and 26. There were statistically significant differences between true acupuncture vs standard oral hygiene at week 4 (P = .002) and between true acupuncture vs standard oral hygiene (P = .001) and true acupuncture vs sham acupuncture (P = .005) at week 12.
