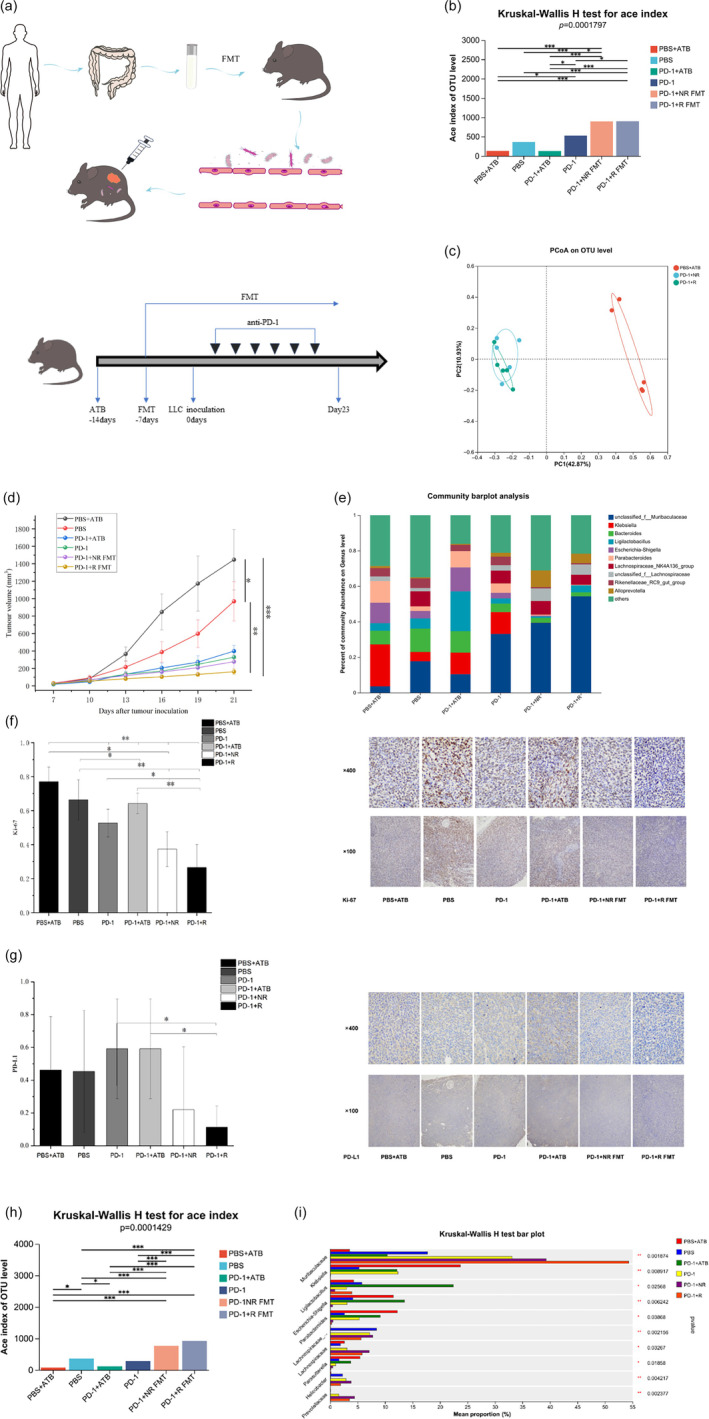
FIGURE 4.

Transcriptomic and metabolomic analysis of syngeneic tumor models treated with responders (R) and nonresponders (NR). (a) Experimental protocol. (b, c) Characteristics of intestinal flora of the phosphate buffered saline (PBS) + antibiotic (ATB), PBS, PD‐1, PD‐1 + ATB, PD‐1 + NR FMT, and PD‐1 + responders fecal microbiota transplantation (R‐FMT) groups, there was a significant difference between the groups in the level of diversity ace index, p < 0.05. (d) Growth curves of subcutaneous tumors in C57BL mice. (e) Characteristics of intestinal flora at the level of alpha diversity ace index of the PBS + ATB, PBS, PD‐1, PD‐1 + ATB, PD‐1 + NR, and PD‐1 + R groups at the baseline of treatment. (f, g) Representative immunohistochemical (IHC) analysis. Compared with six groups, the R‐FMT group comprised significantly decreased numbers of Ki‐67 positive cells, p < 0.05. Compared with the PD‐1 + ATB group and PD‐1 group, the R‐FMT group comprised partly decreased numbers of PD‐L1 positive cells, p < 0.05. (h) The bar plot visually shows the changes of different species in six groups. Characteristics of intestinal flora at the level of alpha diversity ace index of the PBS + ATB, PBS, PD‐1, PD‐1 + ATB, PD‐1 + NR FMT, and PD‐1 + R FMT groups after different treatments. (i) Analysis of species differences between the six groups at the genus level. Significant differences were evaluated using the Kruskal‐Wallis rank sum test (b, h, i), ordinary one‐way analysis of variance (ANOVA) (d, f, g) test. Data are expressed as mean ± SEM. *p ≤ 0.05, **0.001 < p ≤ 0.01, ***p ≤ 0.001. PD‐1, programmed death‐1.
