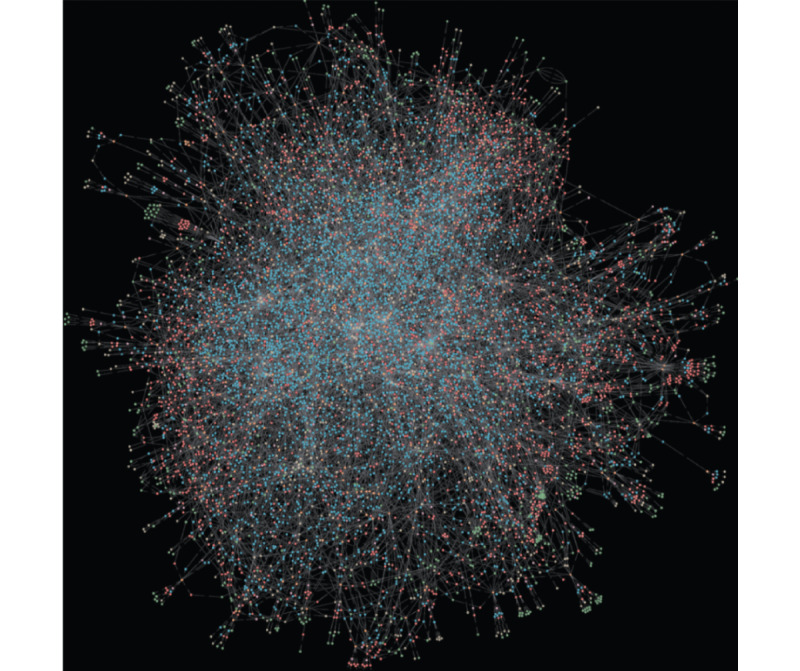
Figure 1.

An actual visualization of Avey’s brain (ie, a probabilistic graphical model). At a high level, the nodes (or dots) can be thought of representing diseases, symptoms, etiologies, or features of symptoms or etiologies, whereas the edges (or links) can be thought of as representing conditional independence assumptions and modeling certain features (eg, sensitivities and specificities) needed for clinical reasoning.
