Table 2.
The descriptions and mathematical definitions of the 7 accuracy metrics used in this study.
| Metric | Description | Mathematical definition |
| M1% | The percentage of vignettes where the gold standard main diagnosis is returned at the top of a symptom checker’s or a doctor’s differential list |
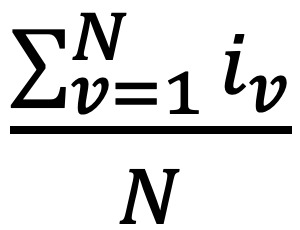 , where N is the number of vignettes and iv is 1 if the symptom checker or doctor returns the gold standard main diagnosis within vignette v at the top of their differential list; and 0 otherwise , where N is the number of vignettes and iv is 1 if the symptom checker or doctor returns the gold standard main diagnosis within vignette v at the top of their differential list; and 0 otherwise |
| M3% | The percentage of vignettes where the gold standard main diagnosis is returned among the first 3 diseases of a symptom checker’s or a doctor’s differential list |
 , where N is the number of vignettes and iv is 1 if the symptom checker or doctor returns the gold standard main diagnosis within vignette v among the top 3 diseases of their differential list; and 0 otherwise , where N is the number of vignettes and iv is 1 if the symptom checker or doctor returns the gold standard main diagnosis within vignette v among the top 3 diseases of their differential list; and 0 otherwise |
| M5% | The percentage of vignettes where the gold standard main diagnosis is returned among the first 5 diseases of a symptom checker’s or a doctor’s differential list |
 , where N is the number of vignettes and iv is 1 if the symptom checker or doctor returns the gold standard main diagnosis within vignette v among the top 5 diseases of their differential list; and 0 otherwise , where N is the number of vignettes and iv is 1 if the symptom checker or doctor returns the gold standard main diagnosis within vignette v among the top 5 diseases of their differential list; and 0 otherwise |
| Average recall | Recall is the proportion of diseases that are in the gold standard differential list and are generated by a symptom checker or a doctor. The average recall is taken across all vignettes for each symptom checker and doctor |
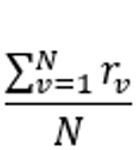 , where N is the number of vignettes and , where N is the number of vignettes and  of the symptom checker or doctor for vignette v of the symptom checker or doctor for vignette v
|
| Average precision | Precision is the proportion of diseases in the symptom checker’s or doctor’s differential list that are also in the gold standard differential list. The average precision is taken across all vignettes for each symptom checker and doctor |
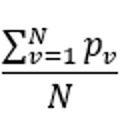 , where N is the number of vignettes and , where N is the number of vignettes and  of the symptom checker or doctor for vignette v of the symptom checker or doctor for vignette v
|
| Average F1-measure | F1-measure captures the trade-off between precision and recall. The average F1-measure is taken across all vignettes for each symptom checker and doctor |
 , where average recall and average precision are as defined at column 3 in rows 4 and 5 above, respectively , where average recall and average precision are as defined at column 3 in rows 4 and 5 above, respectively |
| Average NDCGa | NDCG is a measure of ranking quality. The average NDCG is taken across all vignettes for each symptom checker and doctor |
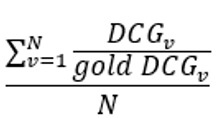 , assuming N vignettes, n number of diseases in a gold standard vignette v, and relevancei for the disease at position 𝑖 in v’s differential list , assuming N vignettes, n number of diseases in a gold standard vignette v, and relevancei for the disease at position 𝑖 in v’s differential list 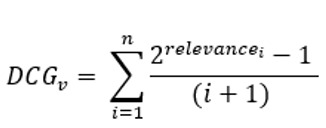 , which is computed over the differential list of a doctor or a symptom checker for v. Gold DCGv is defined exactly as DCGv, but is computed over the gold standard differential list of v , which is computed over the differential list of a doctor or a symptom checker for v. Gold DCGv is defined exactly as DCGv, but is computed over the gold standard differential list of v |
aNDCG: Normalized Discounted Cumulative Gain.
