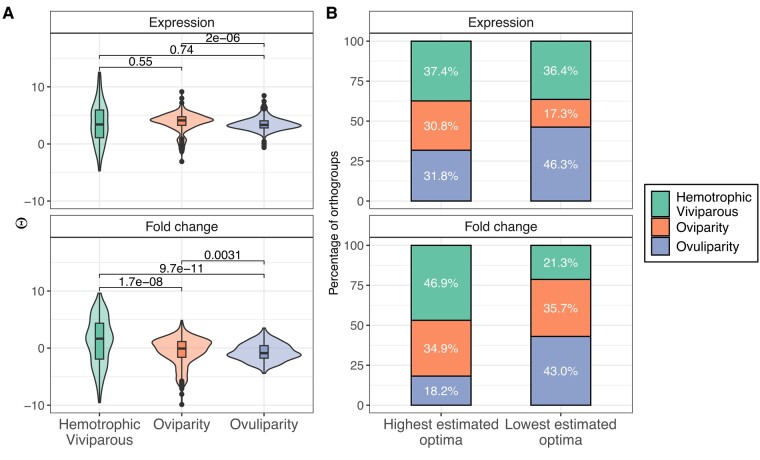
Fig. 3.
ϴ estimates for orthogroups where OUM models were found to be the best-fitting model. A) Distribution of ϴ estimates for the reproductive modes in both expression dataset (above) and fold change dataset (below). Wilcoxon signed-rank test P-value results are displayed above for each pairwise comparison. B) The proportion of highest and lowest ϴ values for both datasets in all three reproductive modes. In each orthogroup, the multiple ϴ estimates have been ordered followed by selecting the highest and lowest ones.

