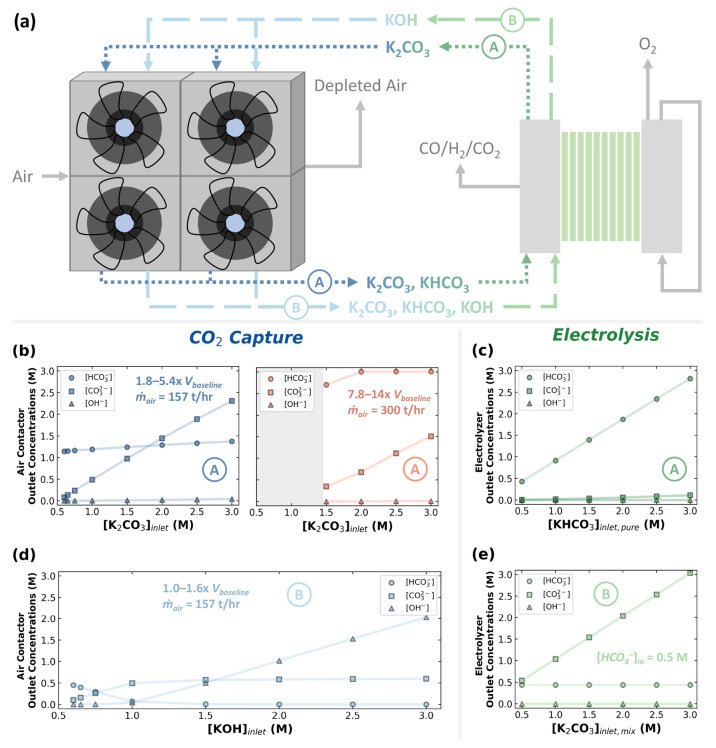
Figure 2.
(a) Schematic of the literature-proposed integration route showing the air contactors on the left and the electrolyzer stacks on the right. Note the two possible pathways: (A) K2CO3-based and (B) KOH-based capture. The air contactor outlet concentrations of HCO3–, CO32–, and OH– as a function of the air contactor inlet concentration of (b) K2CO3 and (d) KOH are shown. The right-hand plot in (b) shows the outlet anionic species concentrations after increasing the air flow rate and contactor volume for the inlet K2CO3 concentrations of 2–3 M. The catholyte outlet concentrations of HCO3–, CO32–, and OH– as a function of the catholyte inlet concentration of (c) KHCO3 and (e) K2CO3/KHCO3 mixtures are also shown. For all air contactor calculations, except for (b)-right, we assume a CO2 absorption rate of 646 t-CO2/yr at a CO2 capture fraction of approximately 78%. For (b)-right, the CO2 absorption rate is 1340–1454 5-CO2/yr and the CO2 capture fraction is 85–93%.

