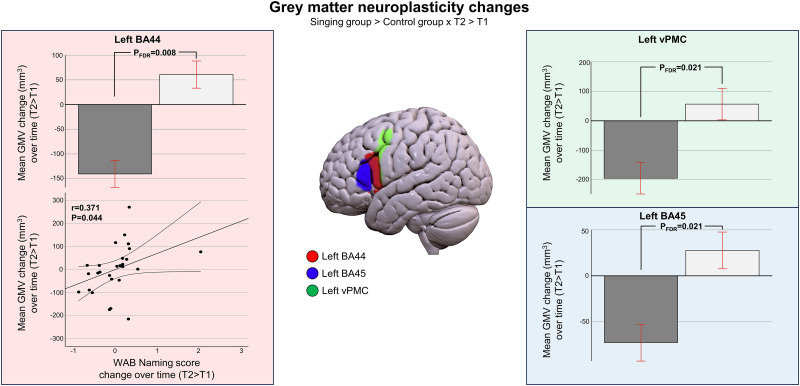
Figure 4.
Treatment-induced GM neuroplasticity changes. Longitudinal GM volume increases (singing group > control group) in T2 > T1 and longitudinal GM volume change correlation with improved naming. Additional exploratory voxel-wise analyses are reported in Extended Data Figure 4-1. Bar plots for mean group GM volume changes are shown: bar, mean; error bar, standard error of mean. BA, Brodmann area; FDR, false discovery rate; vPMC, ventral premotor cortex.

