Fig. 2.
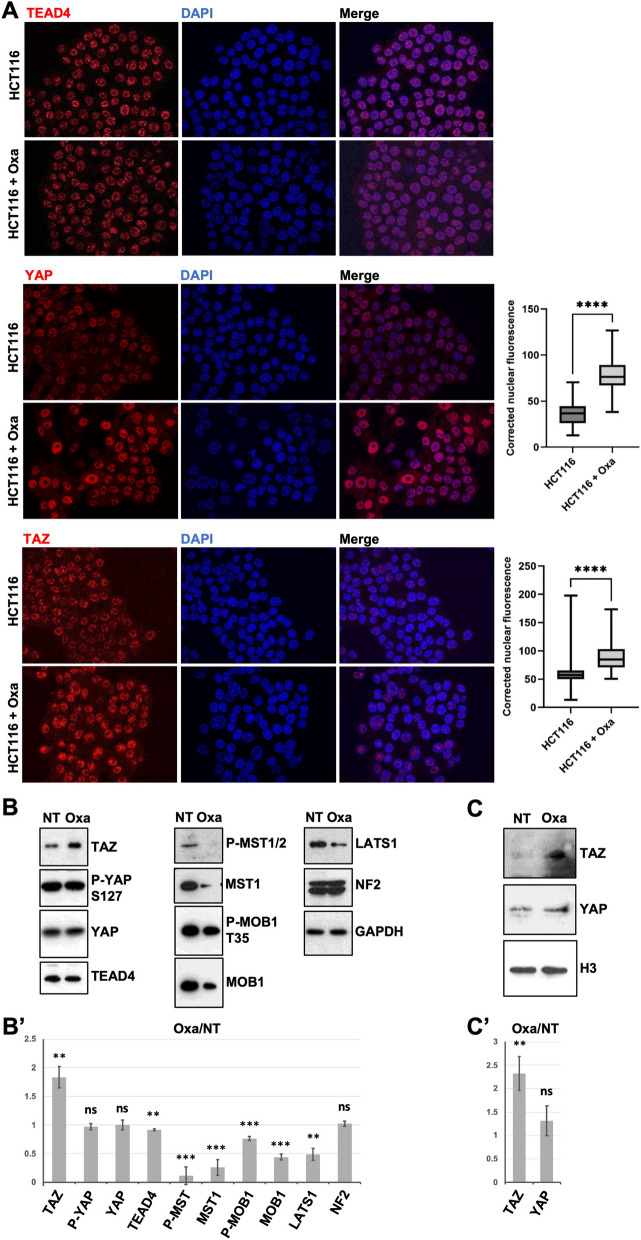
Oxaliplatin treatment triggers YAP and TAZ nuclear accumulation. A Immunofluorescence experiments performed on HCT116 cells treated, or not, with oxaliplatin (0.5 µM) monitoring TEAD4 (top panels), YAP (middle panels), and TAZ (bottom panels) nuclear localization (red). DAPI (blue) was used to stain DNA and the nuclei. Quantification of YAP and TAZ stainings are shown on the right side of the figures and are represented as the corrected nuclear fluorescence. Data are represented as the mean ± SEM (n = 3). Unpaired two-tailed Student’s t-test; **** p < 0.0001. B Western blot analysis showing protein expression and/or activation of Hippo pathway components in HCT116 cells treated (Oxa), or not (NT) with oxaliplatin (0.5 µM). GAPDH was used as a loading control (n = 3). B’ Quantification of the ratio Oxa/NT of the western-blots shown in B after normalization by GAPDH intensity. Average is shown with standard deviation. Unpaired two-tailed t-test; ** p < 0.01, *** p < 0.001, ns non-significant. C Western blot analysis after subcellular fractionation showing the relative amount of YAP and TAZ protein in the nuclear fraction of HCT116 cells treated (Oxa), or not (NT) with oxaliplatin (0.5 µM). Histone H3 was used as a nuclear loading control for the fractionation (n = 3). C’ Quantification of the ratio Oxa/NT of the western-blots shown in B after normalization by Histone H3 intensity. Average is shown with standard deviation. Unpaired two-tailed t-test; ** p < 0.01, *** p < 0.001, ns non-significant

