Fig. 4.
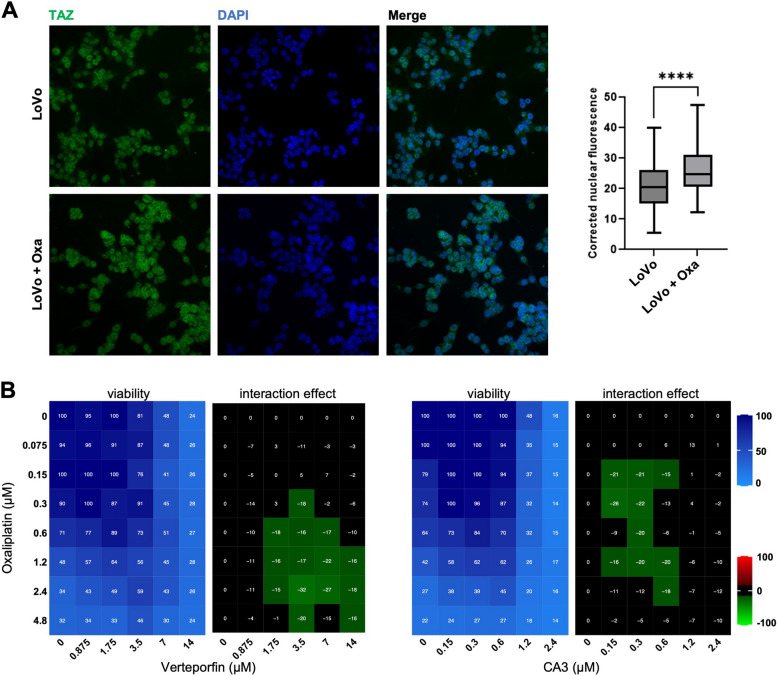
Oxaliplatin treatment effects in LoVo cells. A Immunofluorescence experiments performed on LoVo cells treated or not, with oxaliplatin at IC50 (0.6 μM) monitoring TAZ nuclear localization (green). DAPI (blue) was used to stain DNA and the nuclei. Quantifications are shown on the right side of the figure and are represented as the corrected nuclear fluorescence. Data are represented as the mean ± SEM. Unpaired two-tailed Student’s t-test; **** p < 0.0001. B LoVo cells were incubated with increasing concentrations of oxaliplatin and either Verteporfin or CA3. Cell viability was assessed with the SRB assay in 2D to obtain the viability matrix. Drug concentrations were as follows: Verteporfin (from 0.875 to 14 µM), CA3 (from 0.15 to 2.4 µM) and Oxaliplatin (from 0.075 to 4.8 µM). The synergy matrices were calculated as described in “Materials and methods” section

