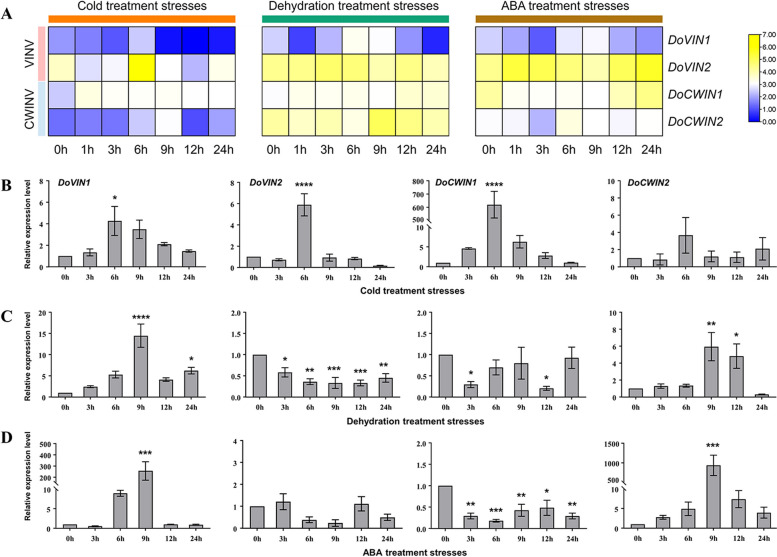
Fig. 7.
Expression patterns of DoAINV genes in response to abiotic stress. A Expression profiles of DoAINV genes in the D. officinale DanXia cultivar under cold, dehydration, and ABA treatment stresses. The heatmap was generated using TBtools software, based on the log2 (FPKM). Blue and red represent low and high levels of transcript abundance, respectively. B, C and D Expression levels of DoAINV genes in the D. officinale DanXia cultivar in response to cold, dehydration, and ABA treatment stresses, respectively, as determined by qRT-PCR experiments. The x-axis items, 0 h, 3 h, 6 h, 9 h, 12 h and 24 h, indicate different treatment times for cold stress (B), dehydration stress (C), and ABA stress (D), respectively. The y-axis represents the relative expression level. The values are the mean of three biological replicates, with SDs indicated by error bars. Significant differences were analyzed by t-test. **** and *** significant difference represents P < 0.001, ** Significant difference at P < 0.01, * significant difference (P < 0.05)

