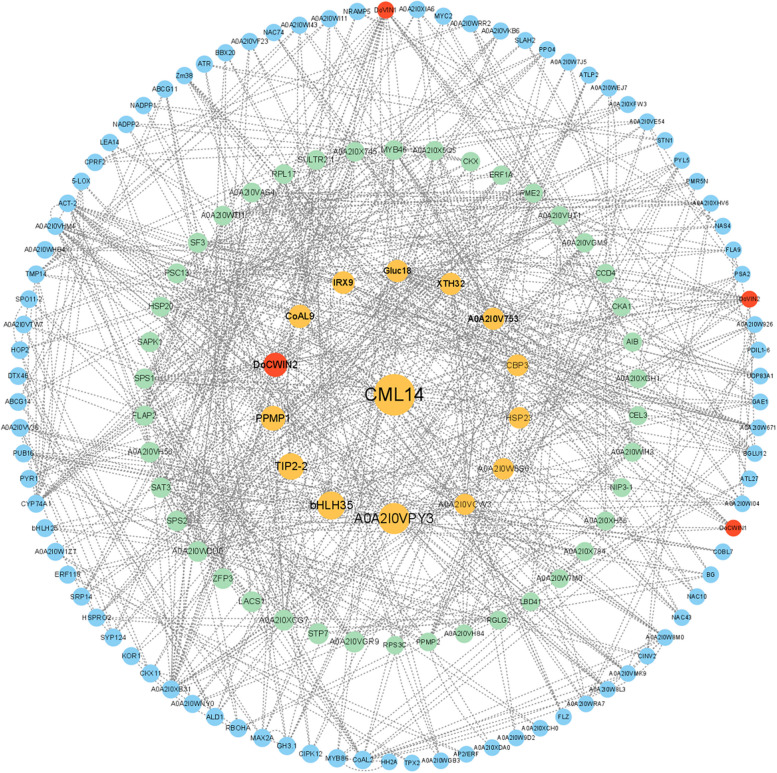
Fig. 9.
Protein–protein interaction (PPI) networks of DoAINV proteins. The network was generated based on the potential interaction data for 1,363 DEGs, extracted from the latest STRING database (STRING v11.5) and screened for transcriptomic data in cold stress treatment at 6 h compared to 0 h. Node size indicates its connectivity measured as node degree (i.e., the number of edges connecting the node); the bigger node means higher connectivity. Blue, green, and orange nodes represent different degrees of importance, with orange nodes indicating a Betweenness (BC) value > 1,000, green nodes presenting 1,000 > BC > 400, and blue nodes at BC < 400. Red nodes represent DoAINV family members. The edges (the connecting line) indicate the interaction between two genes, with the weight of the edges measuring their interaction strength. Thick edges denote strong interaction, whereas thin edges represent weak interaction

