Fig. 2.
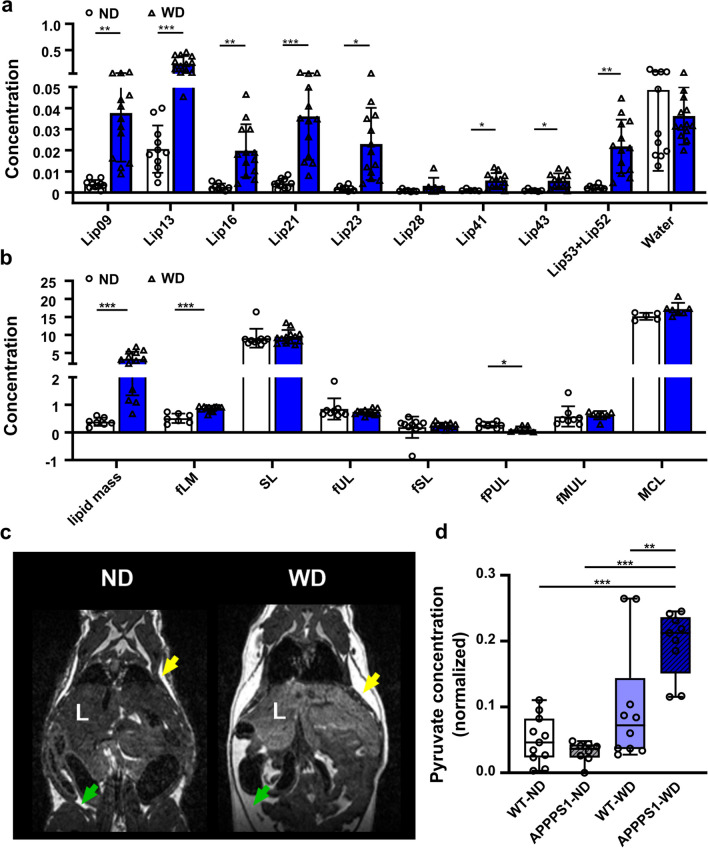
MR-based lipid analysis and metabolomics. 1H MRS of hepatic lipid composition and metabolomic results between ND and WD-fed animals. a single lipids are depicted according to their chemical shift, indicating changes between ND (white, circles)- and WD-fed animals (blue, triangles). b Calculated lipid compositions using the single lipid peaks. c Exemplary contrast-normalized T2-weighted images illustrating fat depots in ND- and WD-fed mice. Subcutaneous fat is marked with yellow arrows; abdominal fat is marked with green arrows. d Box plot of pyruvate changes between the four mice groups. where the following components are defined: center line, median; box limits, 25–75 percentiles; whiskers, minimum to maximum; and all points are shown. WT-ND n = 11 (male = 7, female = 4), APPPS1-ND n = 8 (male = 4, female = 4), WT-WD n = 10 (male = 4, female = 6), APPPS1-WD n = 9 (male = 4, female = 5). 1H MRS results were analyzed using multiple unpaired t-tests with post hoc multiple comparison corrections using the Holm-Sidak method (p-value threshold set to α = 0.05). Metabolomics with two-way ANOVA, post hoc Holm-Sidak correction for multiple comparisons. fLM, fractional lipid mass; SL, saturated lipid component; fUL, fraction of unsaturated lipids; fSL, fraction of saturated lipids; fPUL, fraction of polyunsaturated lipids; fMUL, fraction of monounsaturated lipids; L, liver; Statistical significance: *p < 0.05, **p < 0.01, ***p < 0.001

