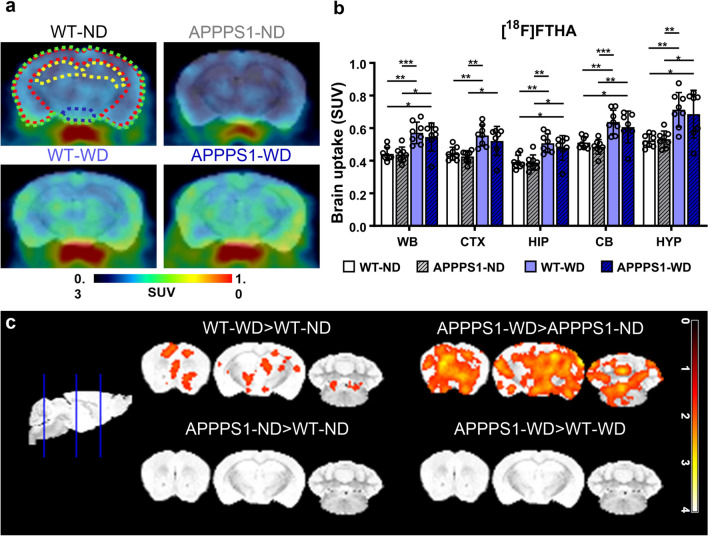
Fig. 4.
[18F]FTHA-PET imaging. a Exemplary axial brain images of [18F]FTHA uptake display higher uptake in WD-fed mice irrespective of genotype. Regions are indicated as follows: green = WB; red = CTX; yellow = HIP; blue = HYP. b Mean SUVs (30–60 min p.i.) in WB, CTX, HIP, CB, and HYP for [18F]FTHA. c Comparison of voxel-wise analysis. The threshold was set to p < 0.05. Individual data points are shown and displayed with mean and SD. WT-ND n = 8 (male = 5, female = 3), APPPS1-ND n = 8 (male = 4, female = 4), WT-WD n = 8 (male = 5, female = 3), APPPS1-WD n = 7 (male = 4, female = 3). *p < 0.05, **p < 0.01, ***p < 0.001, post hoc Holm-Sidak corrected for multiple comparisons; WB, whole brain; CTX, cortex; HIP, hippocampus; CB, cerebellum; HYP , hypothalamus

