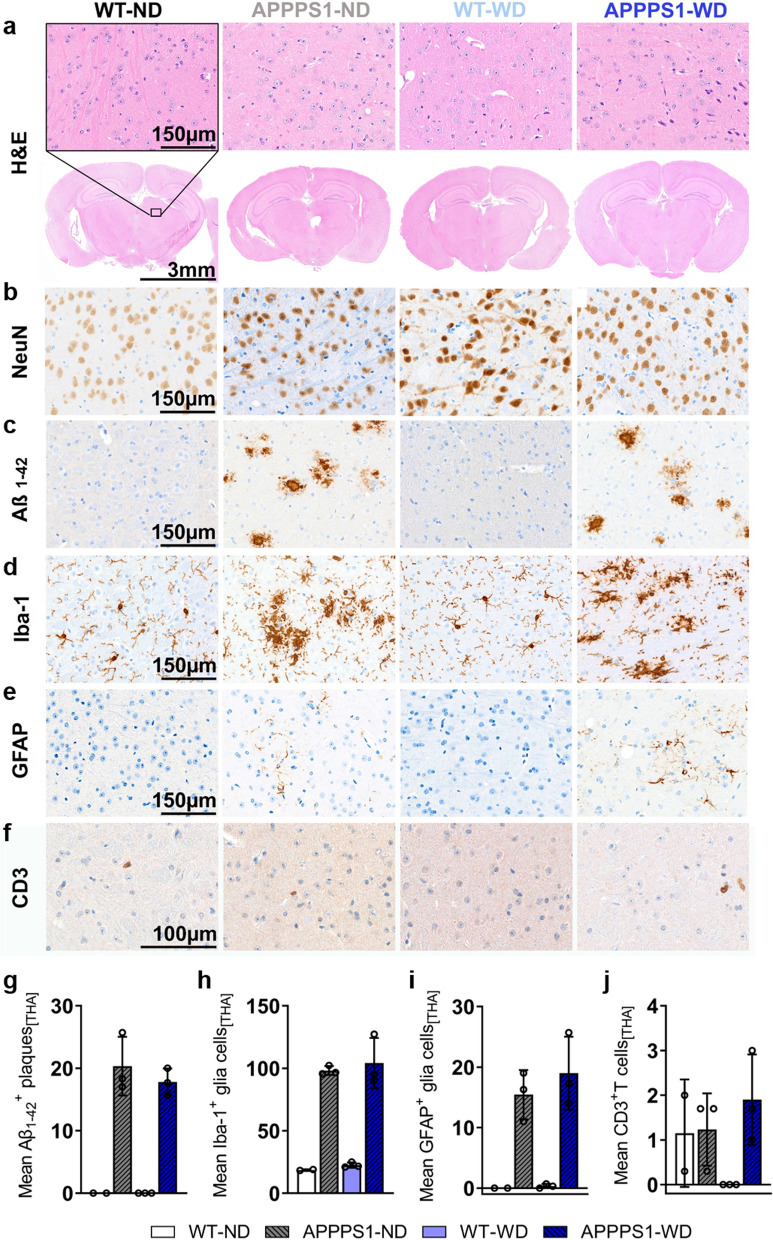
Fig. 8.
Histological analysis—Thalamus. Histological staining results are depicted in representative images per group per staining for the thalamus (THA) in all groups. a H&E staining between groups as overview (Scale bar 3 mm) and magnification (Scale bar 150 µm). The black rectangular depicts magnification area. b No difference in NeuN+ cells between groups. c Aβ1-42 positive plaques were visible in APPPS1 animals (Scale bar 150 µm). d Microglia staining using Iba-1. Ramified/resting phenotype in WT brains and activated amoeboid phenotype of microglia in transgenic AD animals was observed. (Scale bar 150 µm). e GFAP+ cells in APPPS1 animals in THA. No GFAP + cells were found in WT animals. (Scale bar 150 µm). f CD3+ T cells observed in WT-ND and APPPS1 ND and WD (Scale bar 100 µm). g Mean ± SD Aβ1-42 positive plaques load in THA in transgenic mice. h Mean ± SD Iba-1+ cells are elevated in APPPS1 animals. i No mean ± SD GFAP+ cells in WT mice, but elevated in APPPS1 mice. j Similar mean ± SD CD3 positive T cells in WT-ND, APPPS1-ND and APPPS1-WD group. THA = thalamus. WT-ND n = 2; APPPS1-ND n = 3; WT-WD n = 3; APPPS1-WD n = 3

