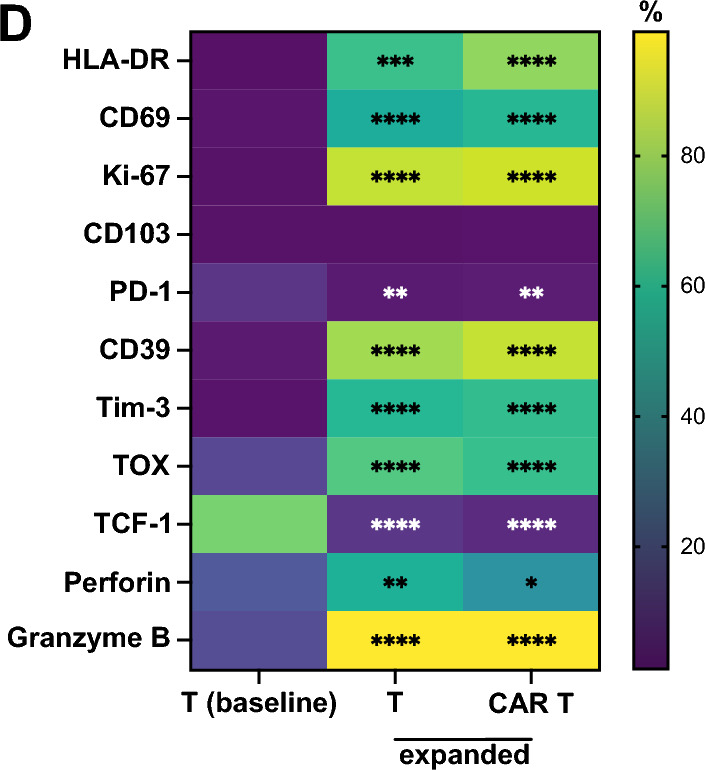
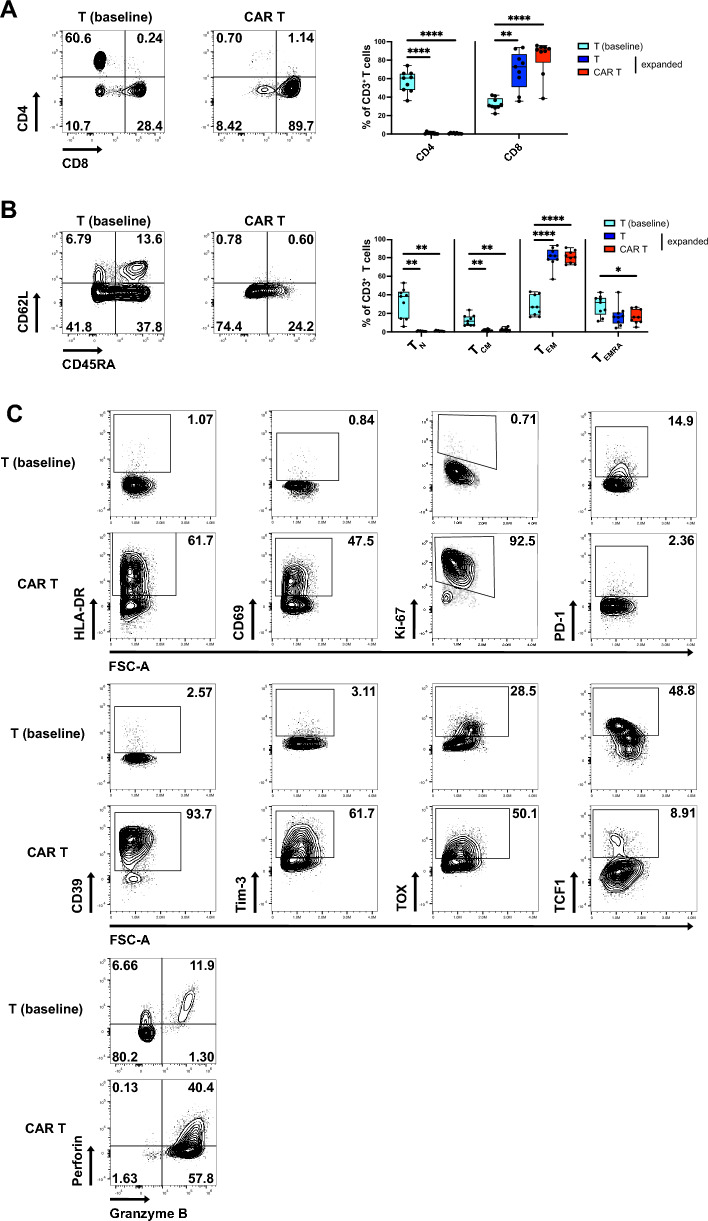
Fig. 2.

Phenotype of expanded CAR T and untransduced T cells CAR T cells or untransduced T cells were expanded for 3 weeks and phenotype analyzed by flow cytometry. A Flow cytometric analysis of CD4 and CD8 expression and percentages of CD4+ and CD8+ T cells within freshly isolated CD3+ T cells (baseline), expanded untransduced T cells and expanded CAR T cells. B Flow cytometric analysis of T cell differentiation and percentages of naïve (TN, CD45RA+CD62L+), central memory (TCM, CD45RA−CD62L+), effector memory (TEM, CD45RA−CD62L−) and TEMRA (CD45RA+CD62L−) cells within T cell populations. (C) Representative contour plots showing marker expression in freshly isolated CD3+ T cells and expanded CAR T cells. (D) Heat map showing differences in marker expression in CD3+ T cells freshly isolated from PBMCs vs. expanded untransduced T cells and freshly isolated CD3+ T cells vs. expanded CAR T cells. Data are from 3 independent experiments with n = 6–9 donors. Significance by RM one-way ANOVA with Tukey’s multiple comparisons or 2way ANOVA with Tukey’s multiple comparisons as appropriate; *p < 0.05, **p < 0.01, ***p < 0.001, ****p < 0.0001. Symbols in (A) and (B) represent individual donors. Data shown as box and whiskers display the median as a line within the box; whiskers are shown from minimum to maximum data point

