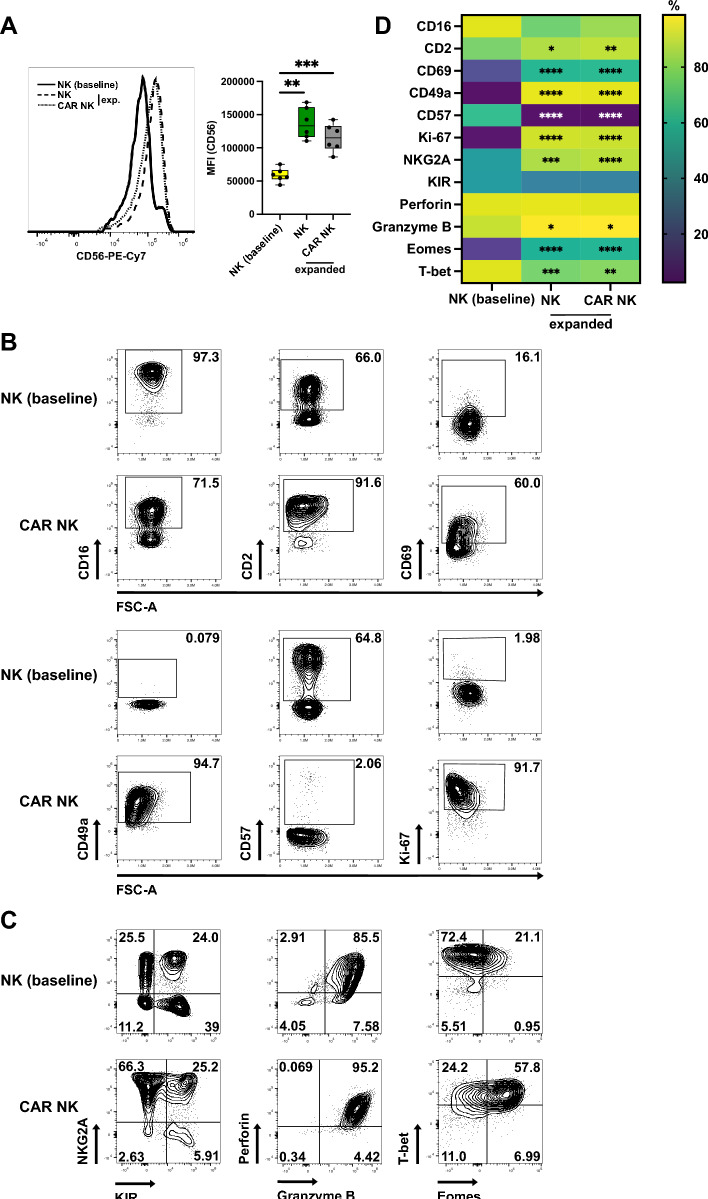
Fig. 3.
Phenotype of expanded CAR NK and untransduced NK cells. CAR NK cells or untransduced NK cells were expanded for 3 weeks and phenotype analyzed by flow cytometry. A Representative histograms of CD56 expression (left) and average CD56 intensity (MFI) on freshly isolated CD3−CD56+ NK cells (baseline) and expanded NK populations. (B, C) Representative contour plots showing expression of markers of NK cell differentiation, residency and proliferation (B), NKG2A, KIR, cytolytic effector molecules as well as transcription factors T-bet and Eomes (C) on freshly isolated NK cells and expanded CAR NK cells. D Heat map showing differences in marker expression in NK T cells freshly isolated from PBMCs vs. expanded untransduced NK cells and freshly isolated NK cells vs. expanded CAR NK cells. Data are from 3 independent experiments with n = 5–9 donors. Significance by RM one-way ANOVA with Tukey’s multiple comparisons or one-way ANOVA with Tukey’s multiple comparisons as appropriate; *p < 0.05, **p < 0.01, ***p < 0.001, ****p < 0.0001. Symbols in (A) represent individual donors. Data shown as box and whiskers display the median as a line within the box; whiskers are shown from minimum to maximum data point

