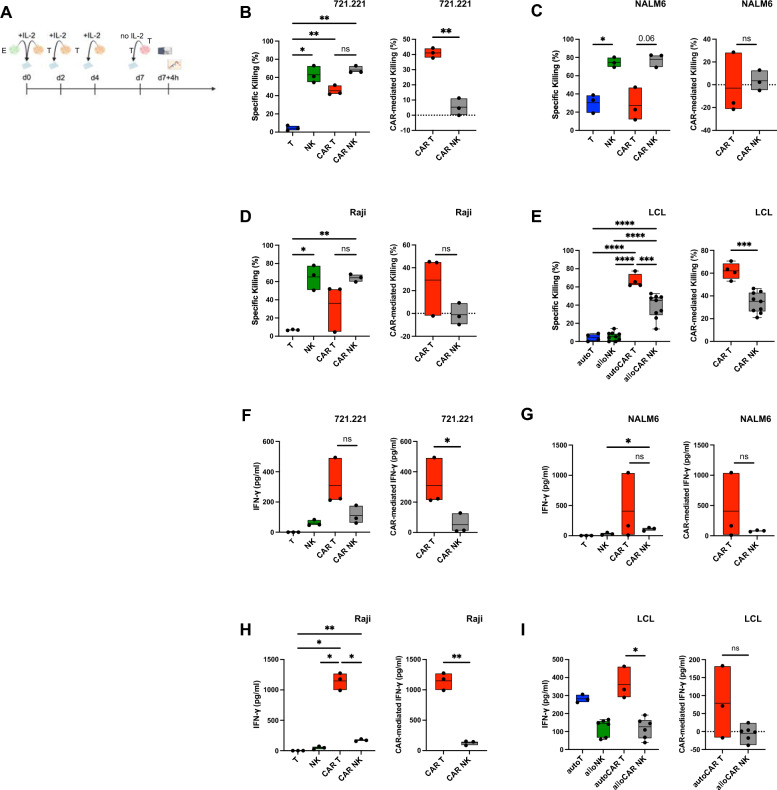
Fig. 6.
In vitro functionality of CAR T and CAR NK cells after repetitive, long-term restimulation. Expanded cells were repetitively cocultured for one week with the indicated cancer cell lines in the presence of 100 U/ml IL-2. Specific killing after the final 4-h target cell restimulation without IL-2 was assessed by flow cytometry using a membrane-impermeable DNA stain (TO-PRO-3) and PKH26 membrane-labeled target cells. IFN-γ production was measured by ELISA. A Schematic of the timeline for multiple restimulations experiments. (B-E) Specific (left) and CAR-mediated (right) killing after repetitive restimulation of 721.221 cells (B), NALM6 cells (C) or Raji cells (D) by anti-CD19 CAR T, CAR NK cells and untransduced controls and of LCL (E) by autologous anti-CD19 CAR T cells, allogeneic anti-CD19 CAR NK cells and untransduced controls. (F-I) Overall (left) and CAR-mediated (right) IFN-γ production after final 4-h coculture following repetitive restimulation with 721.221 cells (F), NALM6 cells (G) or Raji cells (H) by anti-CD19 CAR T, CAR NK cells and untransduced controls and with LCL (I) by autologous anti-CD19 CAR T cells, allogeneic anti-CD19 CAR NK cells and untransduced controls. Data are from 1 to 2 independent experiments with n = 3–9 donors. Significance by mixed-effects analysis, RM one-way ANOVA with Tukey’s multiple comparisons, ordinary one-way ANOVA with Tukey’s multiple comparisons, two-tailed paired t-test or two-tailed unpaired t-test as appropriate; *p < 0.05, **p < 0.01, ***p < 0.001, ****p < 0.0001. Symbols represent individual donors. Data shown as box and whiskers display the median as a line within the box; whiskers are shown from minimum to maximum data point

