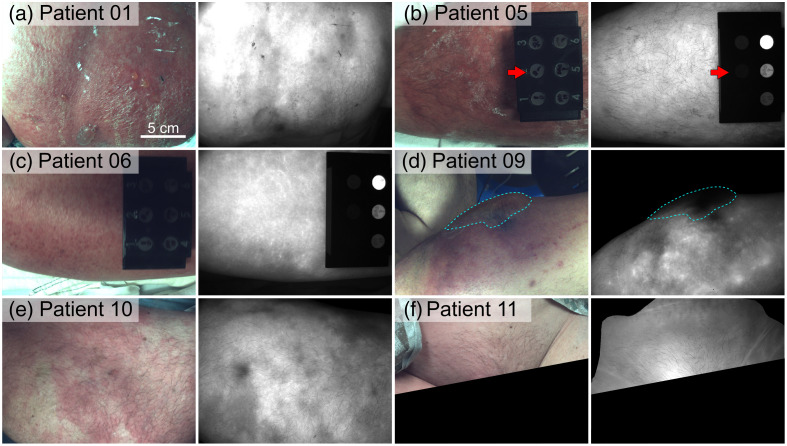
Fig. 2.
(a)–(f) White light color images and representative ICG fluorescence images (snapshots) of confirmed cases of cellulitis. Red arrows annotate an ICG-equivalent, 3D-printed fluorescence standard, pictured in select cases in the study. (d) Patient 09 had a surface tissue bulla delineated by the cyan dashed line. The scale bar in panel (a) applies to all images.

