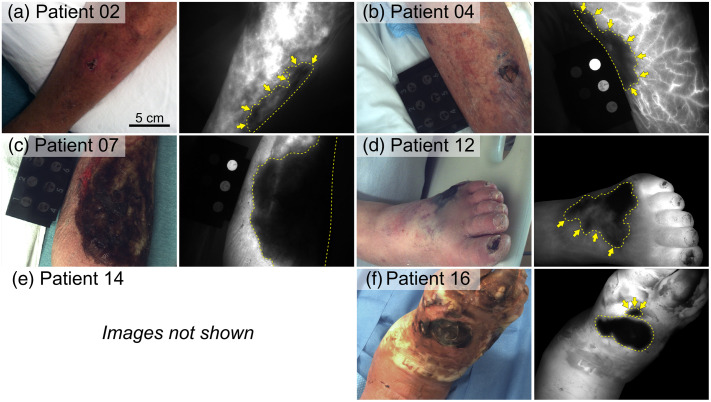
Fig. 3.
(a)–(f) White light color images and representative ICG fluorescence images (snapshots) of confirmed cases of NSTI. Yellow dashed lines delineate fluorescence signal voids indicative of diminished blood perfusion caused by infection. Yellow arrows highlight affected tissues not clearly resolved in white light color images. (e) Patient 14 images are not shown because the infection involved the genitalia. The scale bar in panel (a) applies to all images.

