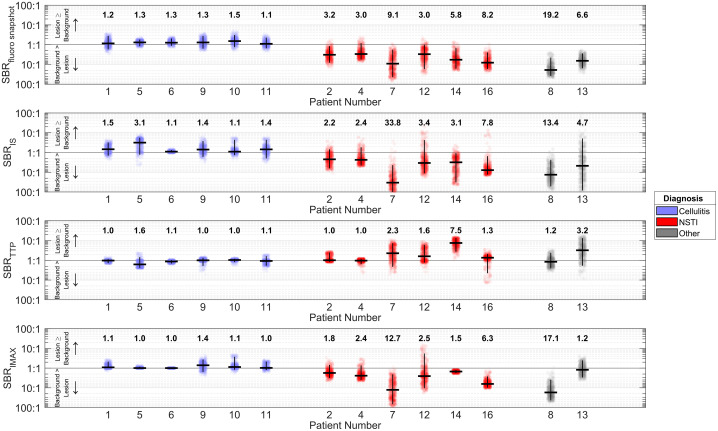
Fig. 5.
SBR distributions for cases that exhibited prominent ICG fluorescence signal voids, including all NSTI cases, one case of diabetes mellitus-associated gangrene (patient 08), and one case of osteomyelitis (patient 13). SBR distributions were determined by paired random sampling of lesion and background tissue ROIs. The horizontal black lines denote distribution medians; these median SBRs are also typed above each distribution for clarity. The vertical black lines depict 95% confidence intervals.

