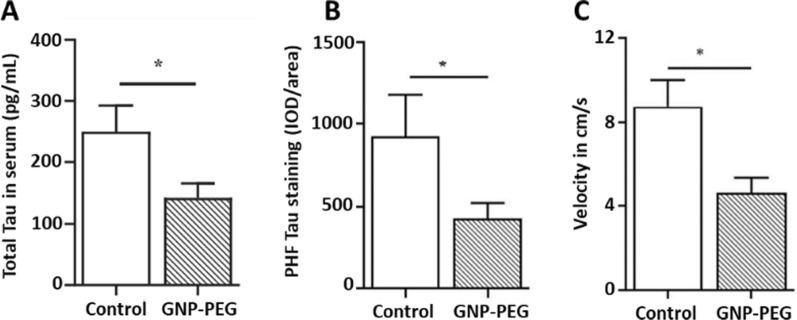
Fig. 7.
A Quantification of total Tau concentration in serum samples of control and GNP-PEG-treated tau P301L mice using an ELISA assay after 30 days of treatment. B Quantification of integrated optical densities (IOD) values in control (n = 6) and treated groups (n = 6) for paired helical filament-positive cells using Image-Pro Plus analysis. C Novel object recognition test for the examination of learning and memory, in which the mice exhibited altered velocity. Adapted with permission from Ref. [194].
Copyright 2020, with permission from John Wiley and Sons

