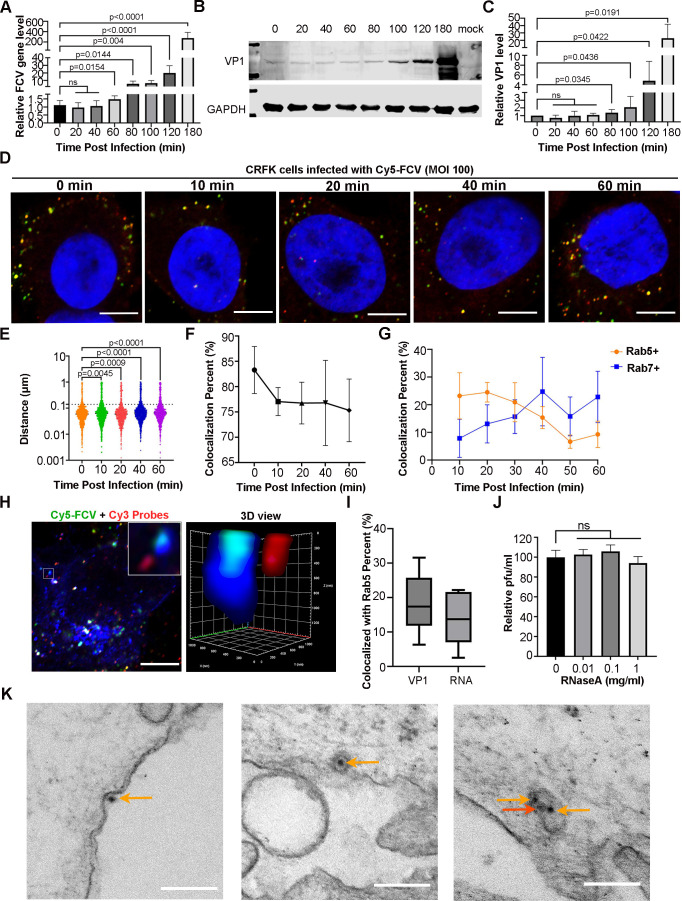
Fig 1.
FCV RNA release in the early endosome. (A) Quantification of the viral RNA levels at the indicated time points post infection. After FCV (100 MOI) adsorption for 60 min at 4°C, cells were transitioned to 37°C and viral RNA was extracted and tested using a RT-qPCR. (B) WB results of VP1 levels. FCV infection was performed as described in (A), and VP1 was detected using a mAb against VP1 (Abcam). (C) Quantitative presentation of VP1 levels is shown in (B). The data in (A and C) come from three independent experiments. The Student’s t-test was used to measure the difference between two independent groups, and the P-value for each comparison is provided. (D) The confocal microscope images show the colocalization of FCV capsids (indicated by green fluorescence signals) and gRNA (indicated by red fluorescence signals). The nucleus was stained with DAPI Scale bar, 5 µm. (E) The scatter plot depicts the variation in the distance between the viral capsid and RNA. The statistical analysis was conducted using the Student’s t-test with more than 1,000 pairs of spots. The P value is labeled for each comparison. (F) The curve plots show the change in the percentage of colocalization between viral RNA and the capsid. (G) Quantify of the colocalization percent of VP1 with either Rab5 or Rab7 vesicles at the indicated times. (H) The confocal microscope images show colocalization of viral RNA, capsids, and early endosomes. The inset (left) and 3D view (right) show the separation of viral RNA from the capsids within the early endosomes. Scale bar, 5 µm. (I) Quantify of percentage of VP1 and RNA colocalized with the early endosomes at 10 min post infection. (J) Bar chart shows the relative plaque number of FCV in the presence of 0–1 mg/mL RNase A. Relative pfu/mL were expressed as percentage of no RNase A control. The statistical analysis was source from three independent experiments and calculated by the Student’s t-test. (K) Representative TEM images of FCV-infected cells. The images display FCVs attached to the cell surface (left), within an endosome through clathrin-mediated endocytosis (middle), and inside an endosome via macropinocytosis (right). The brown and red arrows point to the intact and a likely empty FCV particles. Scale bar, 200 nm.

