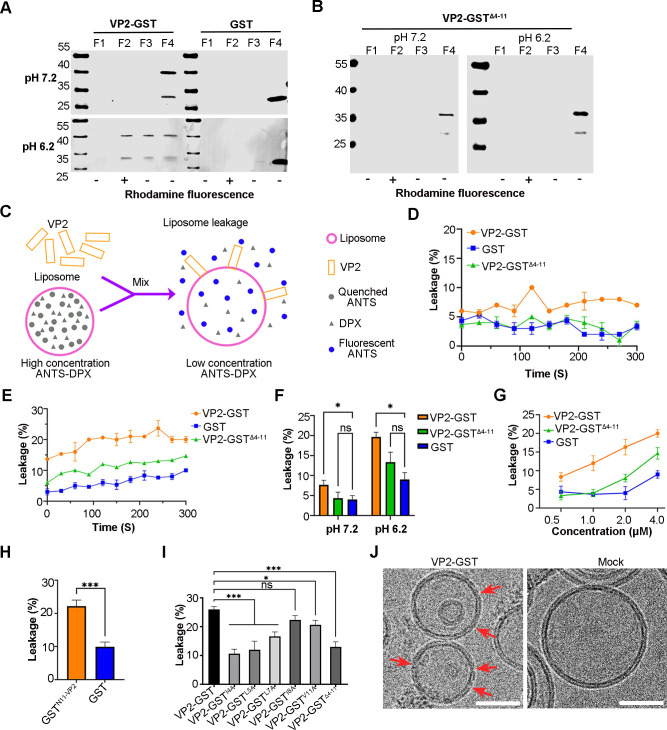
Fig 4.
VP2 binds with liposomes and induces membrane permeability in low pH through N-terminal. (A and B) WB results of flotation assay of VP2-GST (A) and VP2-GSTΔ4-11 (B) at pH 7.2 and 6.2 conditions. The liposomes were mixed with the proteins for 30 min at RT. The mixture was submitted to a flotation assay, and then, the fractions were then analyzed through WB by using anti-GST antibody (GeneTex). (C) The schematic illustration of the leakage assay. (D and E) Comparison of liposome leakage rates led by the proteins at pH 7.2 (D) and pH 6.2 (E). (F) Bar chart shows the difference of the liposome leakage rate caused by the VP2-GST at pH 7.2 and pH 6.2 conditions. (G) Comparison of liposome leakage rates led by different concentrations of the proteins at pH 6.2. (H) Bar chart shows the leakage of liposome caused by GSTN11-VP2 at pH 6.2. Error bars represent SD of the mean from three independent experiments. Asterisks indicate statistical significance calculated by the Student’s t-test, (***P < 0.001). (I) Bar chart shows liposome leakage caused by mutant VP2 proteins at pH 6.2. Error bars in F and I represent the SD from three independent experiments. Asterisks indicate statistical significance among proteins calculated by the one-way analysis of variance (ANOVA) (*P < 0.05, ***P < 0.001). (J) Cryo-EM images illustrate liposome morphology after interaction with VP2. The red arrows (left) point to the pores in the liposome membrane induced by VP2, while the right panel shows an intact liposome without the addition of VP2. Bar, 50 nm.

