Fig 2.
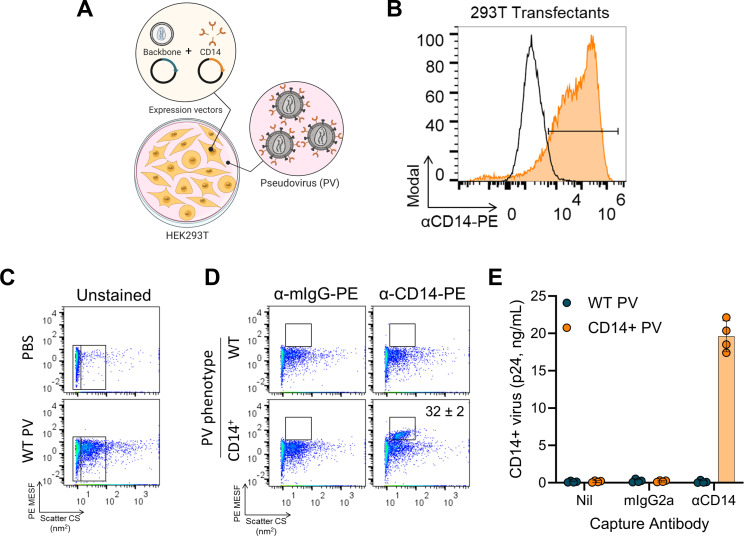
HIV-1 pseudovirus reliably models virion incorporation of CD14. (A) Schematic depicting the process of transfecting 293T cells with plasmids encoding the HIV-1 backbone (pSG3ΔEnv) and CD14 to produce PV bearing CD14 on the surface. (B) Confirming the transfection efficiency of 293T cells ectopically expressing CD14. Cells were transfected with backbone only (black histogram) or backbone plus CD14 (orange histogram) to produce WT or CD14+ PVs, respectively. Cells were collected and stained with PE-conjugated anti-CD14 to confirm cell-surface expression of CD14 available for incorporation. (C) Gating strategy to identify PV populations by FVM. Phosphate-buffered saline (PBS) or WT virions were acquired, and data are displayed on pseudocolored dot plots. Fluorescence data (y-axis) were calibrated to produce quantitative units of MESF (molecules of equivalent soluble fluorophore), which describe the number of fluorophores and, indirectly, the number of antigens detected. Side scatter data (x-axis) were calibrated to produce arbitrary units of scattering cross section (nm2), which relates to the size and refractive index of particles. Gates to the far left (PBS and WT PV) represent the instrument’s optical noise and are present of every FVM plot. Virions are identified as the dense, monodispersed population (right gate) adjacent to the optical noise. (D) WT (top row) and CD14+ (bottom row) virions were stained with PE-conjugated isotype control (left column) or anti-CD14 (right column) (0.4 µg/mL) and analyzed by FVM. Gates were positioned above the unstained PV populations, identifying PE+ events, and were set respective to each isotype control stain. PE MESF values are enumerated where PE+ events are present (mean ± SD, n = 3 independent stains), describing the number of fluorophores detected in each PE+ gate. Virus stocks used in C and D had a titer of 187 ng/mL (WT) and 114 ng/mL (CD14+) of p24 as measured by ELISA. (E) Virion capture assay was performed on WT (teal) and CD14+ (orange) PVs to corroborate CD14 incorporation. “Nil” represents PBS buffer, “mIgG2a” is an isotype-matched control, and “αCD14” is anti-CD14 mAb M5E2. Bars are mean ± SD p24 of four independently produced virus stocks and are representative of at least two independent assays.

