Fig 3.
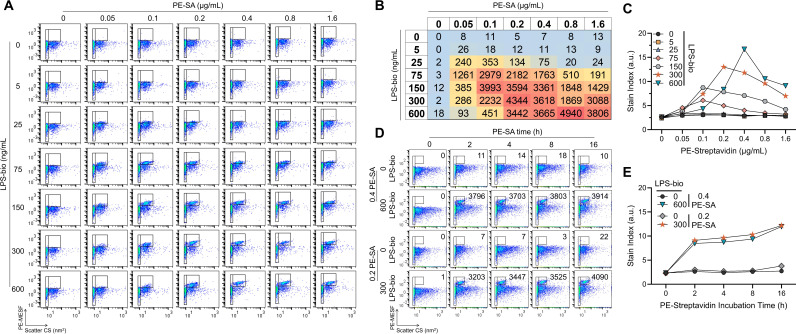
CD14 remains functional in the viral envelope and binds to LPS. (A) FVM was used to read out a checkboard titration of LPS-bio and PE-SA on CD14+ virions to identify optimal staining concentrations. LPS-bio was incubated overnight at 4°C with virus samples and PE-SA was added for 4 h at 4°C the next day before acquisition. Gates to the left identify optical noise used for (C), and gates to the right identify PE+ events that were set respective to each negative control PE-SA stain (top row). CD14+ virus stock shown in FVM plots had a titer of 57 ng/mL p24 as measured by ELISA. (B) The number of particles in the PE+ gates of (A) were tabulated and heat mapped with blue, yellow, and red identifying low, intermediate, and high values, respectively. Higher particle counts identify LPS-bio and PE-SA stains that support CD14+ virions binding. (C) SI was calculated and plotted for each PE-SA concentration using the PE MESF measured in the PE+ gates of (A). Peak SI identifies optimal staining pairs (orange stars and blue inverted triangles). (D) Incubation times for optimal PE-SA pairs from (C) were evaluated over a 16-h time course. Particle counts in PE+ gates (right gates) are enumerated on each plot. CD14+ virus stock shown in FVM plots had a titer of 73 ng/mL p24 as measured by ELISA. (E) SI of PE MESF measured in (D) were plotted over time. All titration data were reproducible across two independent experiments using two independently produced virus stocks. All LPS-bio and PE-SA concentrations in A–E are in units of ng/mL and µg/mL, respectively.

